Immigrants from North Macedonia vs Immigrants from Sri Lanka Associate's Degree
COMPARE
Immigrants from North Macedonia
Immigrants from Sri Lanka
Associate's Degree
Associate's Degree Comparison
Immigrants from North Macedonia
Immigrants from Sri Lanka
47.4%
ASSOCIATE'S DEGREE
76.0/ 100
METRIC RATING
151st/ 347
METRIC RANK
53.7%
ASSOCIATE'S DEGREE
100.0/ 100
METRIC RATING
30th/ 347
METRIC RANK
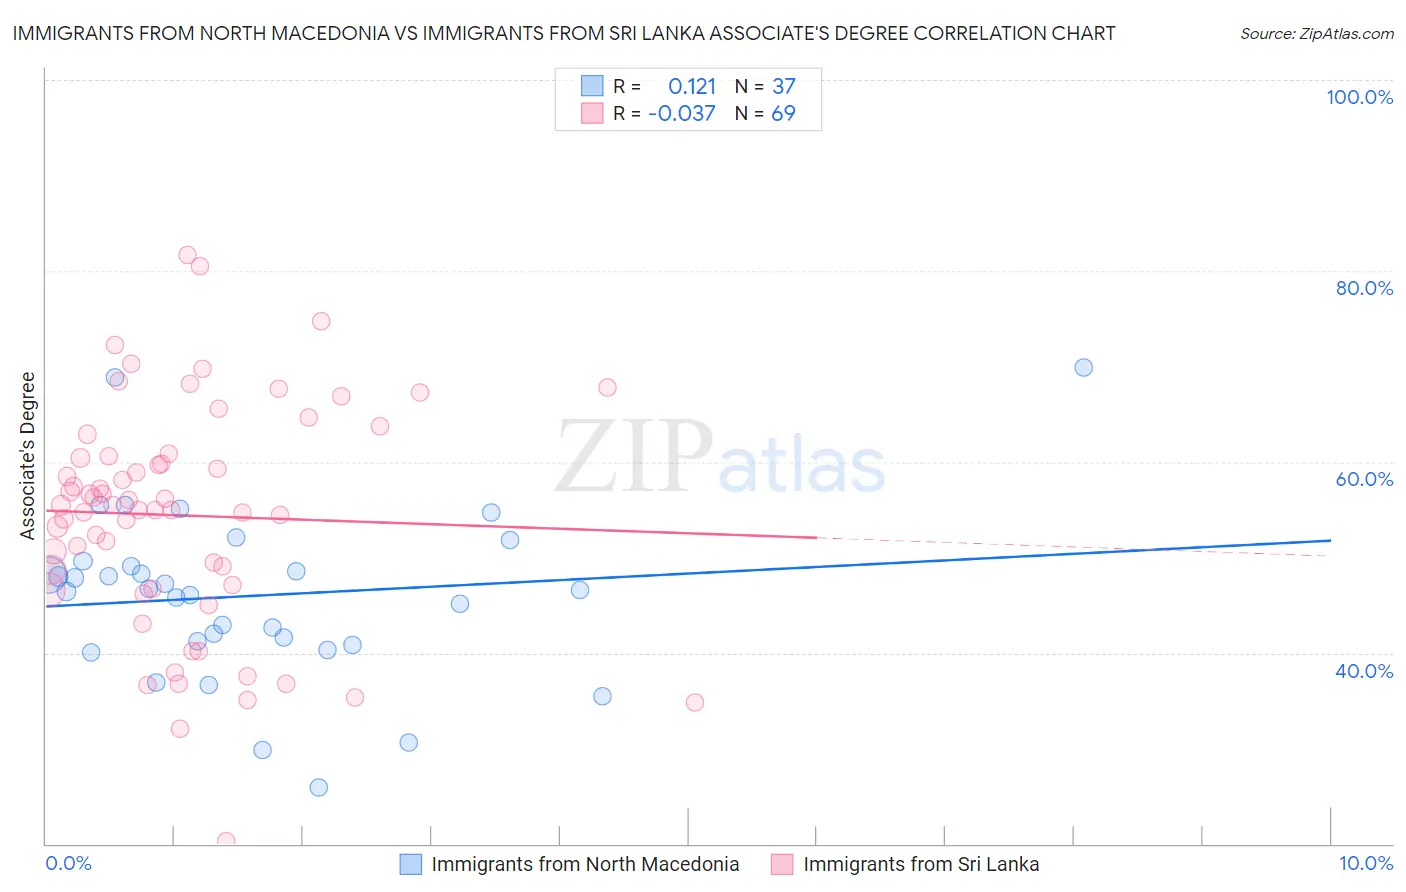
Immigrants from North Macedonia vs Immigrants from Sri Lanka Associate's Degree Correlation Chart
The statistical analysis conducted on geographies consisting of 74,317,045 people shows a poor positive correlation between the proportion of Immigrants from North Macedonia and percentage of population with at least associate's degree education in the United States with a correlation coefficient (R) of 0.121 and weighted average of 47.4%. Similarly, the statistical analysis conducted on geographies consisting of 149,700,552 people shows no correlation between the proportion of Immigrants from Sri Lanka and percentage of population with at least associate's degree education in the United States with a correlation coefficient (R) of -0.037 and weighted average of 53.7%, a difference of 13.3%.
Associate's Degree Correlation Summary
| Measurement | Immigrants from North Macedonia | Immigrants from Sri Lanka |
| Minimum | 25.9% | 20.2% |
| Maximum | 69.8% | 81.7% |
| Range | 43.9% | 61.5% |
| Mean | 46.0% | 54.4% |
| Median | 46.6% | 55.4% |
| Interquartile 25% (IQ1) | 41.0% | 46.8% |
| Interquartile 75% (IQ3) | 49.3% | 60.8% |
| Interquartile Range (IQR) | 8.3% | 13.9% |
| Standard Deviation (Sample) | 9.0% | 11.9% |
| Standard Deviation (Population) | 8.9% | 11.8% |
Similar Demographics by Associate's Degree
Demographics Similar to Immigrants from North Macedonia by Associate's Degree
In terms of associate's degree, the demographic groups most similar to Immigrants from North Macedonia are Iraqi (47.4%, a difference of 0.020%), Immigrants from Armenia (47.4%, a difference of 0.060%), South American Indian (47.4%, a difference of 0.070%), Danish (47.4%, a difference of 0.14%), and Immigrants from Afghanistan (47.3%, a difference of 0.17%).
| Demographics | Rating | Rank | Associate's Degree |
| Slavs | 80.5 /100 | #144 | Excellent 47.6% |
| Canadians | 79.0 /100 | #145 | Good 47.5% |
| Immigrants | Sudan | 77.9 /100 | #146 | Good 47.4% |
| Danes | 77.3 /100 | #147 | Good 47.4% |
| South American Indians | 76.7 /100 | #148 | Good 47.4% |
| Immigrants | Armenia | 76.6 /100 | #149 | Good 47.4% |
| Iraqis | 76.2 /100 | #150 | Good 47.4% |
| Immigrants | North Macedonia | 76.0 /100 | #151 | Good 47.4% |
| Immigrants | Afghanistan | 74.3 /100 | #152 | Good 47.3% |
| Czechs | 72.2 /100 | #153 | Good 47.2% |
| Immigrants | Kenya | 72.1 /100 | #154 | Good 47.2% |
| Kenyans | 70.6 /100 | #155 | Good 47.1% |
| South Americans | 70.5 /100 | #156 | Good 47.1% |
| Sudanese | 70.3 /100 | #157 | Good 47.1% |
| Immigrants | Germany | 69.7 /100 | #158 | Good 47.1% |
Demographics Similar to Immigrants from Sri Lanka by Associate's Degree
In terms of associate's degree, the demographic groups most similar to Immigrants from Sri Lanka are Immigrants from Northern Europe (53.5%, a difference of 0.36%), Immigrants from Turkey (53.4%, a difference of 0.39%), Immigrants from France (53.9%, a difference of 0.42%), Turkish (53.9%, a difference of 0.43%), and Latvian (53.9%, a difference of 0.50%).
| Demographics | Rating | Rank | Associate's Degree |
| Burmese | 100.0 /100 | #23 | Exceptional 54.6% |
| Immigrants | Korea | 100.0 /100 | #24 | Exceptional 54.5% |
| Immigrants | Switzerland | 100.0 /100 | #25 | Exceptional 54.5% |
| Immigrants | Belgium | 100.0 /100 | #26 | Exceptional 54.5% |
| Latvians | 100.0 /100 | #27 | Exceptional 53.9% |
| Turks | 100.0 /100 | #28 | Exceptional 53.9% |
| Immigrants | France | 100.0 /100 | #29 | Exceptional 53.9% |
| Immigrants | Sri Lanka | 100.0 /100 | #30 | Exceptional 53.7% |
| Immigrants | Northern Europe | 100.0 /100 | #31 | Exceptional 53.5% |
| Immigrants | Turkey | 100.0 /100 | #32 | Exceptional 53.4% |
| Israelis | 100.0 /100 | #33 | Exceptional 53.4% |
| Bulgarians | 100.0 /100 | #34 | Exceptional 53.3% |
| Russians | 100.0 /100 | #35 | Exceptional 53.2% |
| Immigrants | Russia | 100.0 /100 | #36 | Exceptional 53.1% |
| Immigrants | Denmark | 100.0 /100 | #37 | Exceptional 53.1% |