Immigrants from North Macedonia vs Danish 4th Grade
COMPARE
Immigrants from North Macedonia
Danish
4th Grade
4th Grade Comparison
Immigrants from North Macedonia
Danes
97.7%
4TH GRADE
83.3/ 100
METRIC RATING
142nd/ 347
METRIC RANK
98.3%
4TH GRADE
100.0/ 100
METRIC RATING
24th/ 347
METRIC RANK
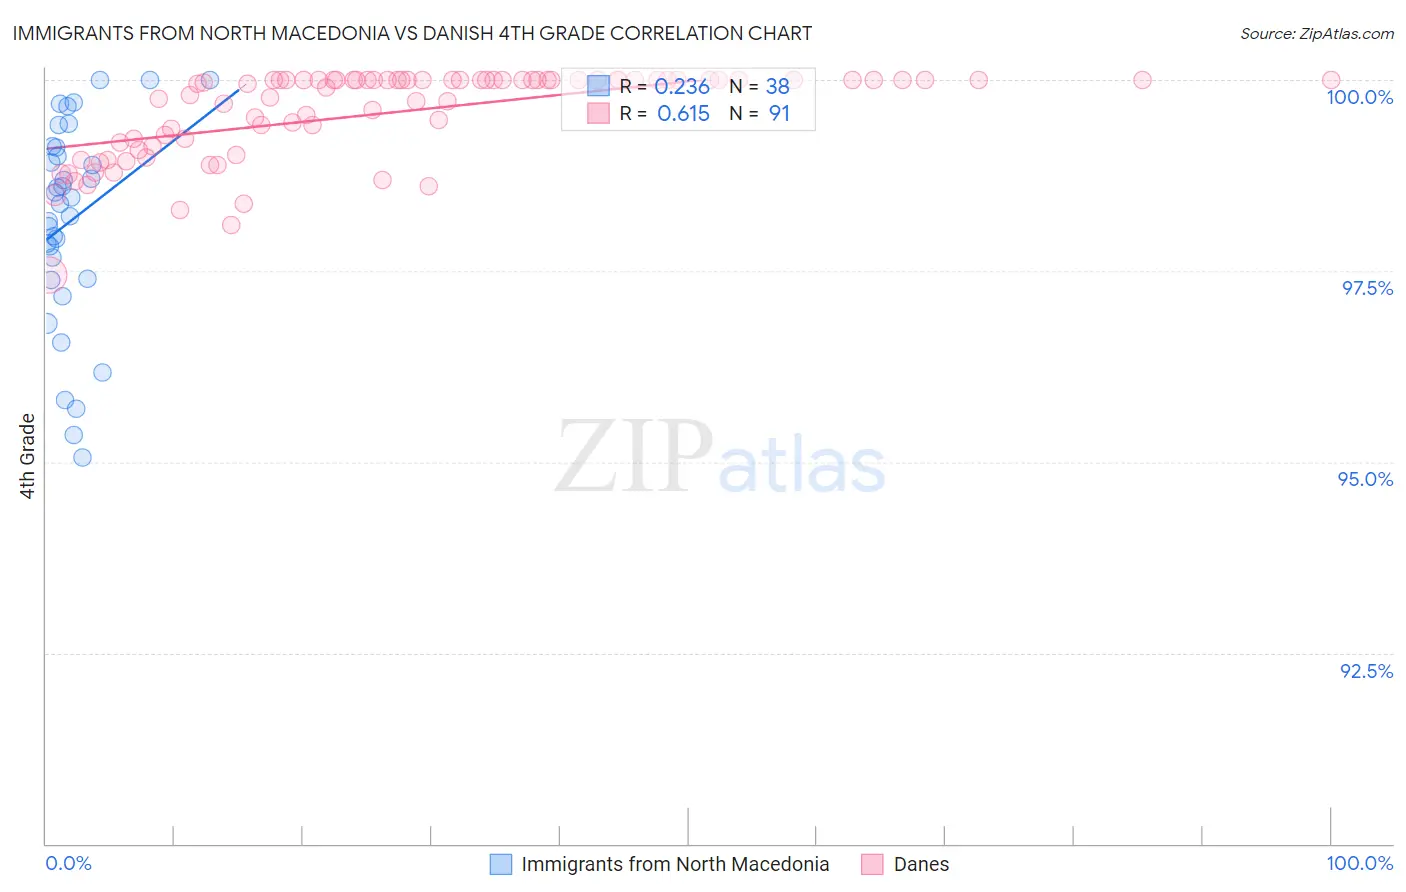
Immigrants from North Macedonia vs Danish 4th Grade Correlation Chart
The statistical analysis conducted on geographies consisting of 74,317,186 people shows a weak positive correlation between the proportion of Immigrants from North Macedonia and percentage of population with at least 4th grade education in the United States with a correlation coefficient (R) of 0.236 and weighted average of 97.7%. Similarly, the statistical analysis conducted on geographies consisting of 474,193,610 people shows a significant positive correlation between the proportion of Danes and percentage of population with at least 4th grade education in the United States with a correlation coefficient (R) of 0.615 and weighted average of 98.3%, a difference of 0.67%.
4th Grade Correlation Summary
| Measurement | Immigrants from North Macedonia | Danish |
| Minimum | 95.1% | 97.4% |
| Maximum | 100.0% | 100.0% |
| Range | 4.9% | 2.6% |
| Mean | 98.2% | 99.6% |
| Median | 98.4% | 100.0% |
| Interquartile 25% (IQ1) | 97.4% | 99.1% |
| Interquartile 75% (IQ3) | 99.1% | 100.0% |
| Interquartile Range (IQR) | 1.7% | 0.87% |
| Standard Deviation (Sample) | 1.3% | 0.58% |
| Standard Deviation (Population) | 1.3% | 0.58% |
Similar Demographics by 4th Grade
Demographics Similar to Immigrants from North Macedonia by 4th Grade
In terms of 4th grade, the demographic groups most similar to Immigrants from North Macedonia are Immigrants from Greece (97.7%, a difference of 0.0%), Burmese (97.7%, a difference of 0.0%), Spaniard (97.7%, a difference of 0.0%), Seminole (97.7%, a difference of 0.010%), and Filipino (97.7%, a difference of 0.010%).
| Demographics | Rating | Rank | 4th Grade |
| Cambodians | 87.8 /100 | #135 | Excellent 97.7% |
| Israelis | 86.2 /100 | #136 | Excellent 97.7% |
| Immigrants | Turkey | 86.0 /100 | #137 | Excellent 97.7% |
| Blackfeet | 86.0 /100 | #138 | Excellent 97.7% |
| Seminole | 84.7 /100 | #139 | Excellent 97.7% |
| Filipinos | 84.0 /100 | #140 | Excellent 97.7% |
| Immigrants | Greece | 83.8 /100 | #141 | Excellent 97.7% |
| Immigrants | North Macedonia | 83.3 /100 | #142 | Excellent 97.7% |
| Burmese | 82.8 /100 | #143 | Excellent 97.7% |
| Spaniards | 82.7 /100 | #144 | Excellent 97.7% |
| Immigrants | Moldova | 82.4 /100 | #145 | Excellent 97.7% |
| Jordanians | 81.3 /100 | #146 | Excellent 97.7% |
| Ute | 80.6 /100 | #147 | Excellent 97.7% |
| Hopi | 80.6 /100 | #148 | Excellent 97.7% |
| Soviet Union | 77.8 /100 | #149 | Good 97.6% |
Demographics Similar to Danes by 4th Grade
In terms of 4th grade, the demographic groups most similar to Danes are Sioux (98.3%, a difference of 0.010%), Scotch-Irish (98.3%, a difference of 0.010%), Croatian (98.3%, a difference of 0.010%), Lithuanian (98.3%, a difference of 0.020%), and Finnish (98.3%, a difference of 0.020%).
| Demographics | Rating | Rank | 4th Grade |
| Pennsylvania Germans | 100.0 /100 | #17 | Exceptional 98.4% |
| Poles | 100.0 /100 | #18 | Exceptional 98.4% |
| Irish | 100.0 /100 | #19 | Exceptional 98.4% |
| Alaska Natives | 100.0 /100 | #20 | Exceptional 98.4% |
| Lithuanians | 100.0 /100 | #21 | Exceptional 98.3% |
| Finns | 100.0 /100 | #22 | Exceptional 98.3% |
| Sioux | 100.0 /100 | #23 | Exceptional 98.3% |
| Danes | 100.0 /100 | #24 | Exceptional 98.3% |
| Scotch-Irish | 100.0 /100 | #25 | Exceptional 98.3% |
| Croatians | 100.0 /100 | #26 | Exceptional 98.3% |
| French Canadians | 100.0 /100 | #27 | Exceptional 98.3% |
| French | 100.0 /100 | #28 | Exceptional 98.3% |
| Czechs | 100.0 /100 | #29 | Exceptional 98.3% |
| Scandinavians | 100.0 /100 | #30 | Exceptional 98.3% |
| Europeans | 100.0 /100 | #31 | Exceptional 98.3% |