Immigrants from North Macedonia vs Spaniard 4th Grade
COMPARE
Immigrants from North Macedonia
Spaniard
4th Grade
4th Grade Comparison
Immigrants from North Macedonia
Spaniards
97.7%
4TH GRADE
83.3/ 100
METRIC RATING
142nd/ 347
METRIC RANK
97.7%
4TH GRADE
82.7/ 100
METRIC RATING
144th/ 347
METRIC RANK
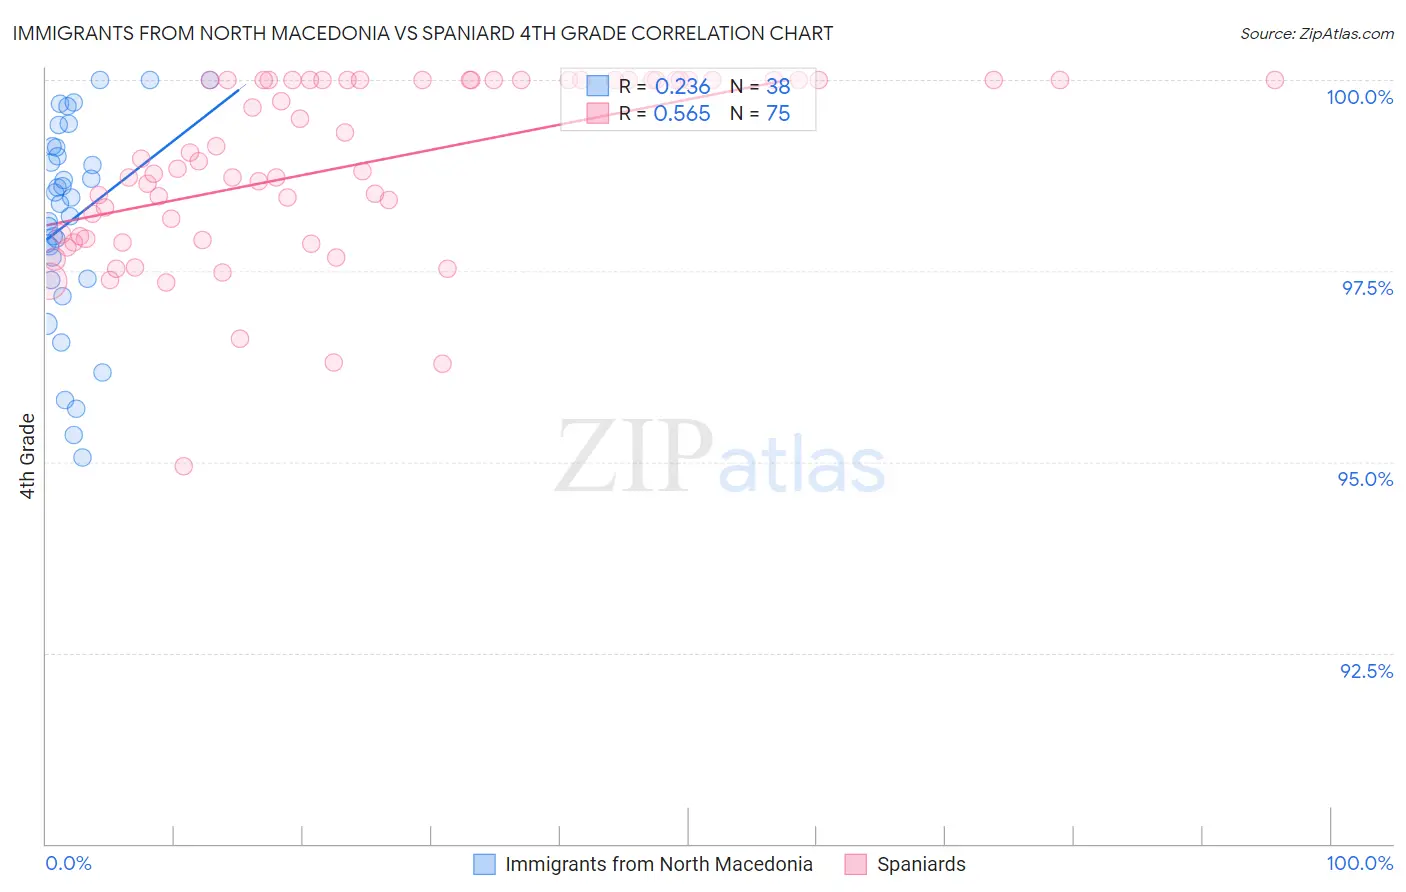
Immigrants from North Macedonia vs Spaniard 4th Grade Correlation Chart
The statistical analysis conducted on geographies consisting of 74,317,186 people shows a weak positive correlation between the proportion of Immigrants from North Macedonia and percentage of population with at least 4th grade education in the United States with a correlation coefficient (R) of 0.236 and weighted average of 97.7%. Similarly, the statistical analysis conducted on geographies consisting of 443,544,503 people shows a substantial positive correlation between the proportion of Spaniards and percentage of population with at least 4th grade education in the United States with a correlation coefficient (R) of 0.565 and weighted average of 97.7%, a difference of 0.0%.
4th Grade Correlation Summary
| Measurement | Immigrants from North Macedonia | Spaniard |
| Minimum | 95.1% | 94.9% |
| Maximum | 100.0% | 100.0% |
| Range | 4.9% | 5.1% |
| Mean | 98.2% | 98.9% |
| Median | 98.4% | 98.9% |
| Interquartile 25% (IQ1) | 97.4% | 97.9% |
| Interquartile 75% (IQ3) | 99.1% | 100.0% |
| Interquartile Range (IQR) | 1.7% | 2.1% |
| Standard Deviation (Sample) | 1.3% | 1.2% |
| Standard Deviation (Population) | 1.3% | 1.2% |
Demographics Similar to Immigrants from North Macedonia and Spaniards by 4th Grade
In terms of 4th grade, the demographic groups most similar to Immigrants from North Macedonia are Immigrants from Greece (97.7%, a difference of 0.0%), Burmese (97.7%, a difference of 0.0%), Seminole (97.7%, a difference of 0.010%), Filipino (97.7%, a difference of 0.010%), and Immigrants from Moldova (97.7%, a difference of 0.010%). Similarly, the demographic groups most similar to Spaniards are Burmese (97.7%, a difference of 0.0%), Immigrants from Moldova (97.7%, a difference of 0.0%), Seminole (97.7%, a difference of 0.010%), Filipino (97.7%, a difference of 0.010%), and Immigrants from Greece (97.7%, a difference of 0.010%).
| Demographics | Rating | Rank | 4th Grade |
| Hmong | 88.2 /100 | #133 | Excellent 97.7% |
| Palestinians | 88.1 /100 | #134 | Excellent 97.7% |
| Cambodians | 87.8 /100 | #135 | Excellent 97.7% |
| Israelis | 86.2 /100 | #136 | Excellent 97.7% |
| Immigrants | Turkey | 86.0 /100 | #137 | Excellent 97.7% |
| Blackfeet | 86.0 /100 | #138 | Excellent 97.7% |
| Seminole | 84.7 /100 | #139 | Excellent 97.7% |
| Filipinos | 84.0 /100 | #140 | Excellent 97.7% |
| Immigrants | Greece | 83.8 /100 | #141 | Excellent 97.7% |
| Immigrants | North Macedonia | 83.3 /100 | #142 | Excellent 97.7% |
| Burmese | 82.8 /100 | #143 | Excellent 97.7% |
| Spaniards | 82.7 /100 | #144 | Excellent 97.7% |
| Immigrants | Moldova | 82.4 /100 | #145 | Excellent 97.7% |
| Jordanians | 81.3 /100 | #146 | Excellent 97.7% |
| Ute | 80.6 /100 | #147 | Excellent 97.7% |
| Hopi | 80.6 /100 | #148 | Excellent 97.7% |
| Soviet Union | 77.8 /100 | #149 | Good 97.6% |
| Immigrants | Israel | 77.7 /100 | #150 | Good 97.6% |
| Alsatians | 77.2 /100 | #151 | Good 97.6% |
| Immigrants | South Central Asia | 76.2 /100 | #152 | Good 97.6% |
| Immigrants | Eastern Europe | 71.3 /100 | #153 | Good 97.6% |