Immigrants from North Macedonia vs Danish Householder Income Ages 25 - 44 years
COMPARE
Immigrants from North Macedonia
Danish
Householder Income Ages 25 - 44 years
Householder Income Ages 25 - 44 years Comparison
Immigrants from North Macedonia
Danes
$100,101
HOUSEHOLDER INCOME AGES 25 - 44 YEARS
95.6/ 100
METRIC RATING
109th/ 347
METRIC RANK
$97,221
HOUSEHOLDER INCOME AGES 25 - 44 YEARS
81.3/ 100
METRIC RATING
142nd/ 347
METRIC RANK
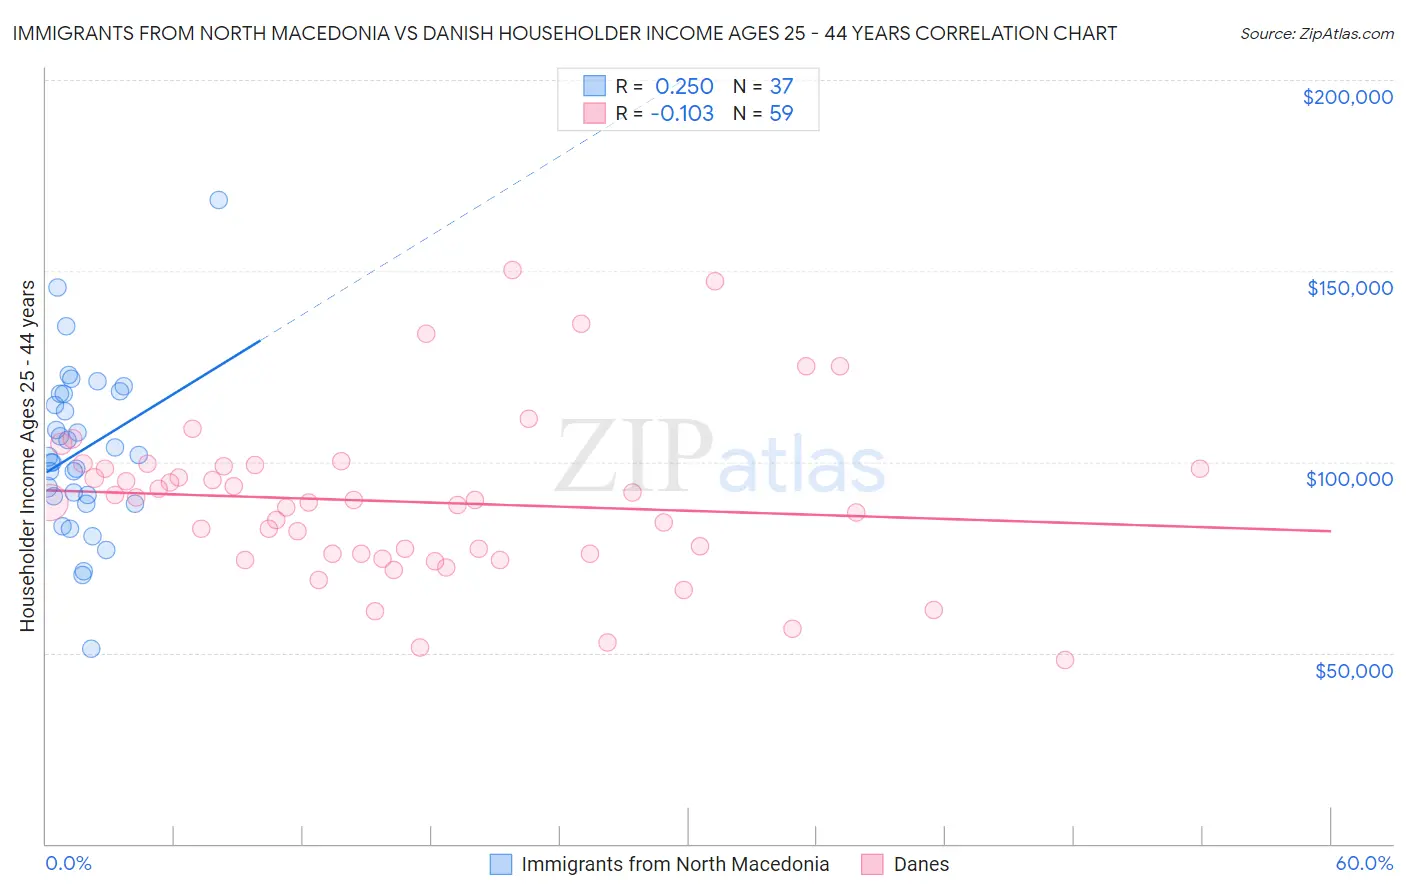
Immigrants from North Macedonia vs Danish Householder Income Ages 25 - 44 years Correlation Chart
The statistical analysis conducted on geographies consisting of 74,266,818 people shows a weak positive correlation between the proportion of Immigrants from North Macedonia and household income with householder between the ages 25 and 44 in the United States with a correlation coefficient (R) of 0.250 and weighted average of $100,101. Similarly, the statistical analysis conducted on geographies consisting of 471,956,523 people shows a poor negative correlation between the proportion of Danes and household income with householder between the ages 25 and 44 in the United States with a correlation coefficient (R) of -0.103 and weighted average of $97,221, a difference of 3.0%.
Householder Income Ages 25 - 44 years Correlation Summary
| Measurement | Immigrants from North Macedonia | Danish |
| Minimum | $51,151 | $48,125 |
| Maximum | $168,534 | $150,222 |
| Range | $117,383 | $102,097 |
| Mean | $102,890 | $89,539 |
| Median | $101,325 | $89,288 |
| Interquartile 25% (IQ1) | $89,993 | $75,783 |
| Interquartile 75% (IQ3) | $117,844 | $98,883 |
| Interquartile Range (IQR) | $27,851 | $23,100 |
| Standard Deviation (Sample) | $21,872 | $21,492 |
| Standard Deviation (Population) | $21,575 | $21,309 |
Similar Demographics by Householder Income Ages 25 - 44 years
Demographics Similar to Immigrants from North Macedonia by Householder Income Ages 25 - 44 years
In terms of householder income ages 25 - 44 years, the demographic groups most similar to Immigrants from North Macedonia are Immigrants from Afghanistan ($99,977, a difference of 0.12%), Immigrants from South Eastern Asia ($100,283, a difference of 0.18%), Chilean ($99,900, a difference of 0.20%), Northern European ($100,457, a difference of 0.36%), and Polish ($99,685, a difference of 0.42%).
| Demographics | Rating | Rank | Householder Income Ages 25 - 44 years |
| Immigrants | Lebanon | 97.4 /100 | #102 | Exceptional $101,124 |
| Immigrants | Moldova | 97.4 /100 | #103 | Exceptional $101,091 |
| Immigrants | Poland | 97.4 /100 | #104 | Exceptional $101,065 |
| Immigrants | Vietnam | 96.5 /100 | #105 | Exceptional $100,535 |
| Immigrants | Brazil | 96.5 /100 | #106 | Exceptional $100,534 |
| Northern Europeans | 96.3 /100 | #107 | Exceptional $100,457 |
| Immigrants | South Eastern Asia | 96.0 /100 | #108 | Exceptional $100,283 |
| Immigrants | North Macedonia | 95.6 /100 | #109 | Exceptional $100,101 |
| Immigrants | Afghanistan | 95.3 /100 | #110 | Exceptional $99,977 |
| Chileans | 95.1 /100 | #111 | Exceptional $99,900 |
| Poles | 94.5 /100 | #112 | Exceptional $99,685 |
| Tongans | 94.2 /100 | #113 | Exceptional $99,604 |
| Immigrants | Western Asia | 94.0 /100 | #114 | Exceptional $99,516 |
| Carpatho Rusyns | 93.7 /100 | #115 | Exceptional $99,449 |
| Portuguese | 93.7 /100 | #116 | Exceptional $99,429 |
Demographics Similar to Danes by Householder Income Ages 25 - 44 years
In terms of householder income ages 25 - 44 years, the demographic groups most similar to Danes are Luxembourger ($97,237, a difference of 0.020%), Immigrants from Jordan ($97,185, a difference of 0.040%), Immigrants from Chile ($97,159, a difference of 0.060%), Immigrants from Morocco ($97,305, a difference of 0.090%), and Immigrants from Peru ($97,329, a difference of 0.11%).
| Demographics | Rating | Rank | Householder Income Ages 25 - 44 years |
| Immigrants | Oceania | 84.5 /100 | #135 | Excellent $97,623 |
| Hungarians | 83.9 /100 | #136 | Excellent $97,544 |
| Lebanese | 82.3 /100 | #137 | Excellent $97,339 |
| Arabs | 82.3 /100 | #138 | Excellent $97,336 |
| Immigrants | Peru | 82.2 /100 | #139 | Excellent $97,329 |
| Immigrants | Morocco | 82.0 /100 | #140 | Excellent $97,305 |
| Luxembourgers | 81.5 /100 | #141 | Excellent $97,237 |
| Danes | 81.3 /100 | #142 | Excellent $97,221 |
| Immigrants | Jordan | 81.0 /100 | #143 | Excellent $97,185 |
| Immigrants | Chile | 80.8 /100 | #144 | Excellent $97,159 |
| Norwegians | 78.2 /100 | #145 | Good $96,866 |
| Ethiopians | 77.8 /100 | #146 | Good $96,824 |
| Immigrants | Syria | 77.4 /100 | #147 | Good $96,789 |
| Irish | 76.9 /100 | #148 | Good $96,730 |
| Basques | 76.6 /100 | #149 | Good $96,709 |