Immigrants from Fiji vs Danish 4th Grade
COMPARE
Immigrants from Fiji
Danish
4th Grade
4th Grade Comparison
Immigrants from Fiji
Danes
95.8%
4TH GRADE
0.0/ 100
METRIC RATING
330th/ 347
METRIC RANK
98.3%
4TH GRADE
100.0/ 100
METRIC RATING
24th/ 347
METRIC RANK
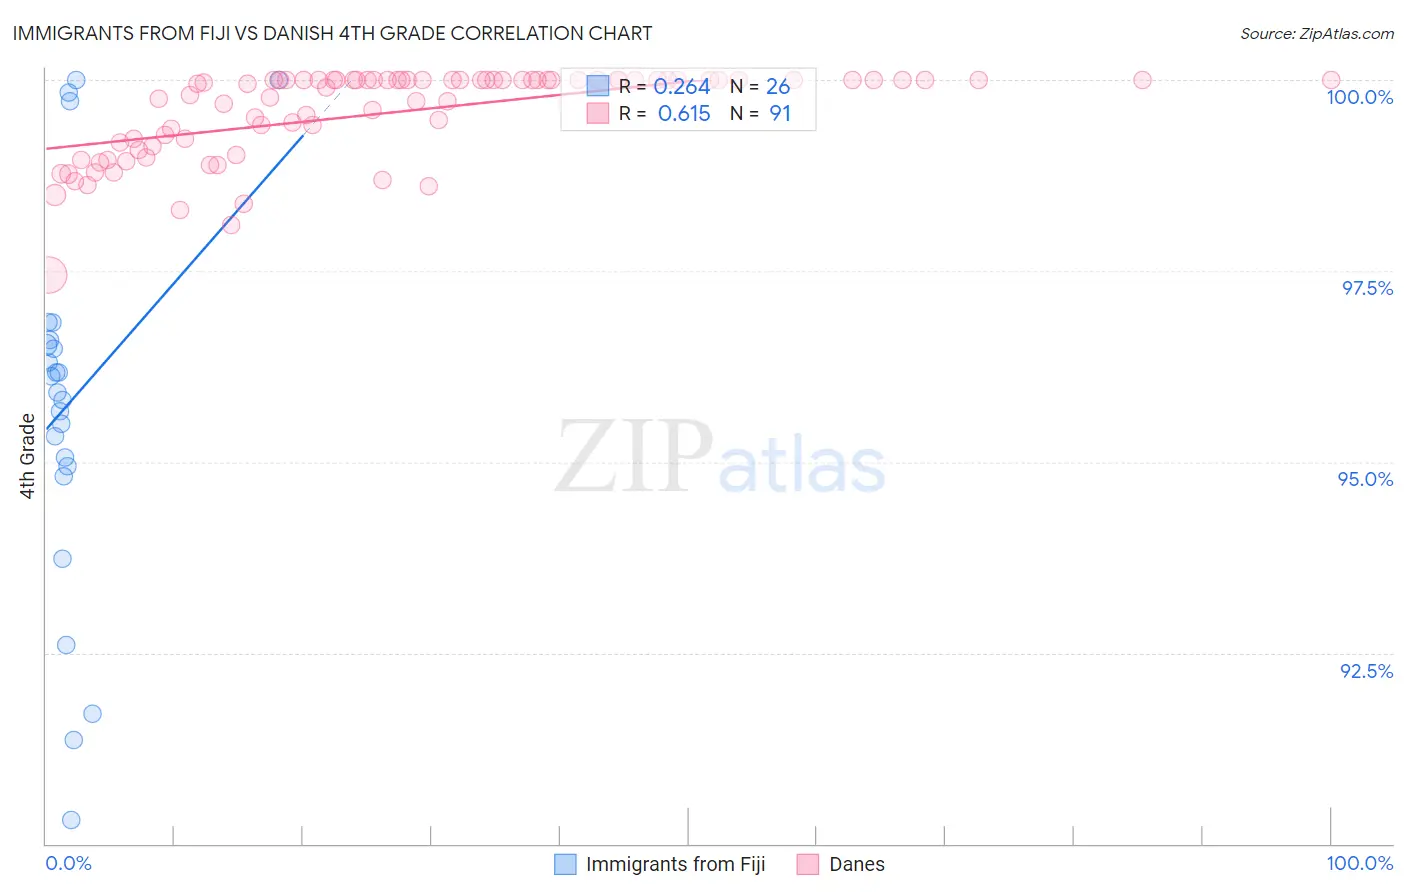
Immigrants from Fiji vs Danish 4th Grade Correlation Chart
The statistical analysis conducted on geographies consisting of 93,756,204 people shows a weak positive correlation between the proportion of Immigrants from Fiji and percentage of population with at least 4th grade education in the United States with a correlation coefficient (R) of 0.264 and weighted average of 95.8%. Similarly, the statistical analysis conducted on geographies consisting of 474,193,610 people shows a significant positive correlation between the proportion of Danes and percentage of population with at least 4th grade education in the United States with a correlation coefficient (R) of 0.615 and weighted average of 98.3%, a difference of 2.6%.
4th Grade Correlation Summary
| Measurement | Immigrants from Fiji | Danish |
| Minimum | 90.3% | 97.4% |
| Maximum | 100.0% | 100.0% |
| Range | 9.7% | 2.6% |
| Mean | 95.8% | 99.6% |
| Median | 96.0% | 100.0% |
| Interquartile 25% (IQ1) | 94.9% | 99.1% |
| Interquartile 75% (IQ3) | 96.6% | 100.0% |
| Interquartile Range (IQR) | 1.7% | 0.87% |
| Standard Deviation (Sample) | 2.5% | 0.58% |
| Standard Deviation (Population) | 2.4% | 0.58% |
Similar Demographics by 4th Grade
Demographics Similar to Immigrants from Fiji by 4th Grade
In terms of 4th grade, the demographic groups most similar to Immigrants from Fiji are Immigrants from Cambodia (95.8%, a difference of 0.0%), Mexican American Indian (95.8%, a difference of 0.020%), Immigrants from Armenia (95.8%, a difference of 0.050%), Immigrants from Honduras (95.8%, a difference of 0.060%), and Immigrants from Dominican Republic (95.7%, a difference of 0.11%).
| Demographics | Rating | Rank | 4th Grade |
| Immigrants | Nicaragua | 0.0 /100 | #323 | Tragic 96.0% |
| Immigrants | Belize | 0.0 /100 | #324 | Tragic 96.0% |
| Dominicans | 0.0 /100 | #325 | Tragic 96.0% |
| Hispanics or Latinos | 0.0 /100 | #326 | Tragic 96.0% |
| Hondurans | 0.0 /100 | #327 | Tragic 96.0% |
| Mexican American Indians | 0.0 /100 | #328 | Tragic 95.8% |
| Immigrants | Cambodia | 0.0 /100 | #329 | Tragic 95.8% |
| Immigrants | Fiji | 0.0 /100 | #330 | Tragic 95.8% |
| Immigrants | Armenia | 0.0 /100 | #331 | Tragic 95.8% |
| Immigrants | Honduras | 0.0 /100 | #332 | Tragic 95.8% |
| Immigrants | Dominican Republic | 0.0 /100 | #333 | Tragic 95.7% |
| Immigrants | Cabo Verde | 0.0 /100 | #334 | Tragic 95.7% |
| Immigrants | Latin America | 0.0 /100 | #335 | Tragic 95.7% |
| Mexicans | 0.0 /100 | #336 | Tragic 95.6% |
| Central Americans | 0.0 /100 | #337 | Tragic 95.5% |
Demographics Similar to Danes by 4th Grade
In terms of 4th grade, the demographic groups most similar to Danes are Sioux (98.3%, a difference of 0.010%), Scotch-Irish (98.3%, a difference of 0.010%), Croatian (98.3%, a difference of 0.010%), Lithuanian (98.3%, a difference of 0.020%), and Finnish (98.3%, a difference of 0.020%).
| Demographics | Rating | Rank | 4th Grade |
| Pennsylvania Germans | 100.0 /100 | #17 | Exceptional 98.4% |
| Poles | 100.0 /100 | #18 | Exceptional 98.4% |
| Irish | 100.0 /100 | #19 | Exceptional 98.4% |
| Alaska Natives | 100.0 /100 | #20 | Exceptional 98.4% |
| Lithuanians | 100.0 /100 | #21 | Exceptional 98.3% |
| Finns | 100.0 /100 | #22 | Exceptional 98.3% |
| Sioux | 100.0 /100 | #23 | Exceptional 98.3% |
| Danes | 100.0 /100 | #24 | Exceptional 98.3% |
| Scotch-Irish | 100.0 /100 | #25 | Exceptional 98.3% |
| Croatians | 100.0 /100 | #26 | Exceptional 98.3% |
| French Canadians | 100.0 /100 | #27 | Exceptional 98.3% |
| French | 100.0 /100 | #28 | Exceptional 98.3% |
| Czechs | 100.0 /100 | #29 | Exceptional 98.3% |
| Scandinavians | 100.0 /100 | #30 | Exceptional 98.3% |
| Europeans | 100.0 /100 | #31 | Exceptional 98.3% |