Cape Verdean vs Danish 4th Grade
COMPARE
Cape Verdean
Danish
4th Grade
4th Grade Comparison
Cape Verdeans
Danes
96.2%
4TH GRADE
0.0/ 100
METRIC RATING
312th/ 347
METRIC RANK
98.3%
4TH GRADE
100.0/ 100
METRIC RATING
24th/ 347
METRIC RANK
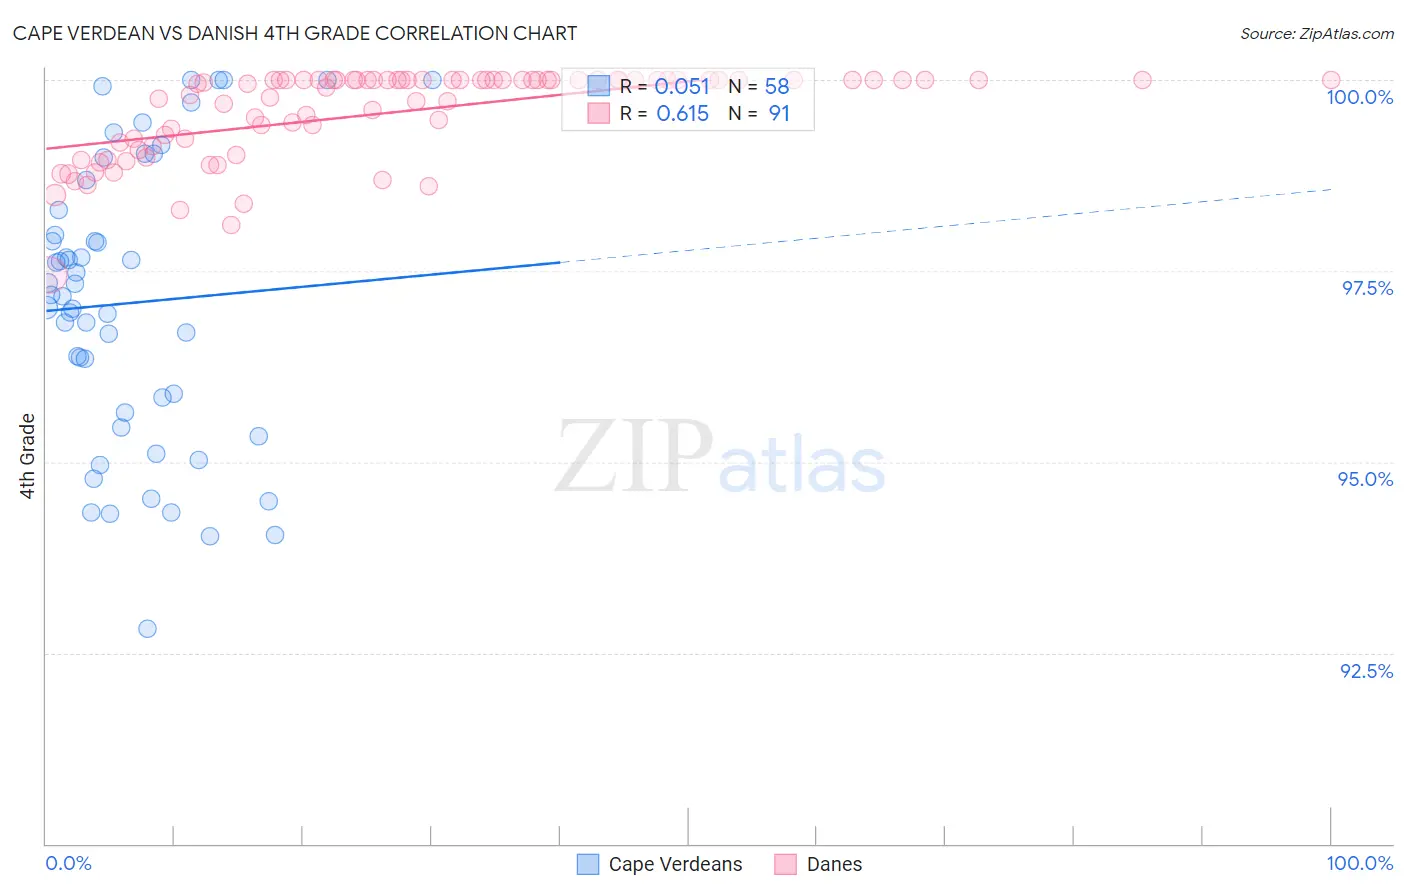
Cape Verdean vs Danish 4th Grade Correlation Chart
The statistical analysis conducted on geographies consisting of 107,537,955 people shows a slight positive correlation between the proportion of Cape Verdeans and percentage of population with at least 4th grade education in the United States with a correlation coefficient (R) of 0.051 and weighted average of 96.2%. Similarly, the statistical analysis conducted on geographies consisting of 474,193,610 people shows a significant positive correlation between the proportion of Danes and percentage of population with at least 4th grade education in the United States with a correlation coefficient (R) of 0.615 and weighted average of 98.3%, a difference of 2.2%.
4th Grade Correlation Summary
| Measurement | Cape Verdean | Danish |
| Minimum | 92.8% | 97.4% |
| Maximum | 100.0% | 100.0% |
| Range | 7.2% | 2.6% |
| Mean | 97.1% | 99.6% |
| Median | 97.2% | 100.0% |
| Interquartile 25% (IQ1) | 95.7% | 99.1% |
| Interquartile 75% (IQ3) | 98.3% | 100.0% |
| Interquartile Range (IQR) | 2.7% | 0.87% |
| Standard Deviation (Sample) | 1.9% | 0.58% |
| Standard Deviation (Population) | 1.8% | 0.58% |
Similar Demographics by 4th Grade
Demographics Similar to Cape Verdeans by 4th Grade
In terms of 4th grade, the demographic groups most similar to Cape Verdeans are Immigrants from Bangladesh (96.2%, a difference of 0.010%), Indonesian (96.2%, a difference of 0.020%), Vietnamese (96.2%, a difference of 0.020%), Nicaraguan (96.2%, a difference of 0.030%), and Immigrants from Ecuador (96.2%, a difference of 0.030%).
| Demographics | Rating | Rank | 4th Grade |
| Immigrants | Caribbean | 0.0 /100 | #305 | Tragic 96.4% |
| Sri Lankans | 0.0 /100 | #306 | Tragic 96.4% |
| Immigrants | Haiti | 0.0 /100 | #307 | Tragic 96.3% |
| Immigrants | Laos | 0.0 /100 | #308 | Tragic 96.3% |
| Immigrants | Guyana | 0.0 /100 | #309 | Tragic 96.3% |
| Immigrants | Burma/Myanmar | 0.0 /100 | #310 | Tragic 96.3% |
| Immigrants | Bangladesh | 0.0 /100 | #311 | Tragic 96.2% |
| Cape Verdeans | 0.0 /100 | #312 | Tragic 96.2% |
| Indonesians | 0.0 /100 | #313 | Tragic 96.2% |
| Vietnamese | 0.0 /100 | #314 | Tragic 96.2% |
| Nicaraguans | 0.0 /100 | #315 | Tragic 96.2% |
| Immigrants | Ecuador | 0.0 /100 | #316 | Tragic 96.2% |
| Central American Indians | 0.0 /100 | #317 | Tragic 96.2% |
| Immigrants | Azores | 0.0 /100 | #318 | Tragic 96.1% |
| Belizeans | 0.0 /100 | #319 | Tragic 96.1% |
Demographics Similar to Danes by 4th Grade
In terms of 4th grade, the demographic groups most similar to Danes are Sioux (98.3%, a difference of 0.010%), Scotch-Irish (98.3%, a difference of 0.010%), Croatian (98.3%, a difference of 0.010%), Lithuanian (98.3%, a difference of 0.020%), and Finnish (98.3%, a difference of 0.020%).
| Demographics | Rating | Rank | 4th Grade |
| Pennsylvania Germans | 100.0 /100 | #17 | Exceptional 98.4% |
| Poles | 100.0 /100 | #18 | Exceptional 98.4% |
| Irish | 100.0 /100 | #19 | Exceptional 98.4% |
| Alaska Natives | 100.0 /100 | #20 | Exceptional 98.4% |
| Lithuanians | 100.0 /100 | #21 | Exceptional 98.3% |
| Finns | 100.0 /100 | #22 | Exceptional 98.3% |
| Sioux | 100.0 /100 | #23 | Exceptional 98.3% |
| Danes | 100.0 /100 | #24 | Exceptional 98.3% |
| Scotch-Irish | 100.0 /100 | #25 | Exceptional 98.3% |
| Croatians | 100.0 /100 | #26 | Exceptional 98.3% |
| French Canadians | 100.0 /100 | #27 | Exceptional 98.3% |
| French | 100.0 /100 | #28 | Exceptional 98.3% |
| Czechs | 100.0 /100 | #29 | Exceptional 98.3% |
| Scandinavians | 100.0 /100 | #30 | Exceptional 98.3% |
| Europeans | 100.0 /100 | #31 | Exceptional 98.3% |