Immigrants from Iraq vs Danish 4th Grade
COMPARE
Immigrants from Iraq
Danish
4th Grade
4th Grade Comparison
Immigrants from Iraq
Danes
97.2%
4TH GRADE
4.6/ 100
METRIC RATING
225th/ 347
METRIC RANK
98.3%
4TH GRADE
100.0/ 100
METRIC RATING
24th/ 347
METRIC RANK
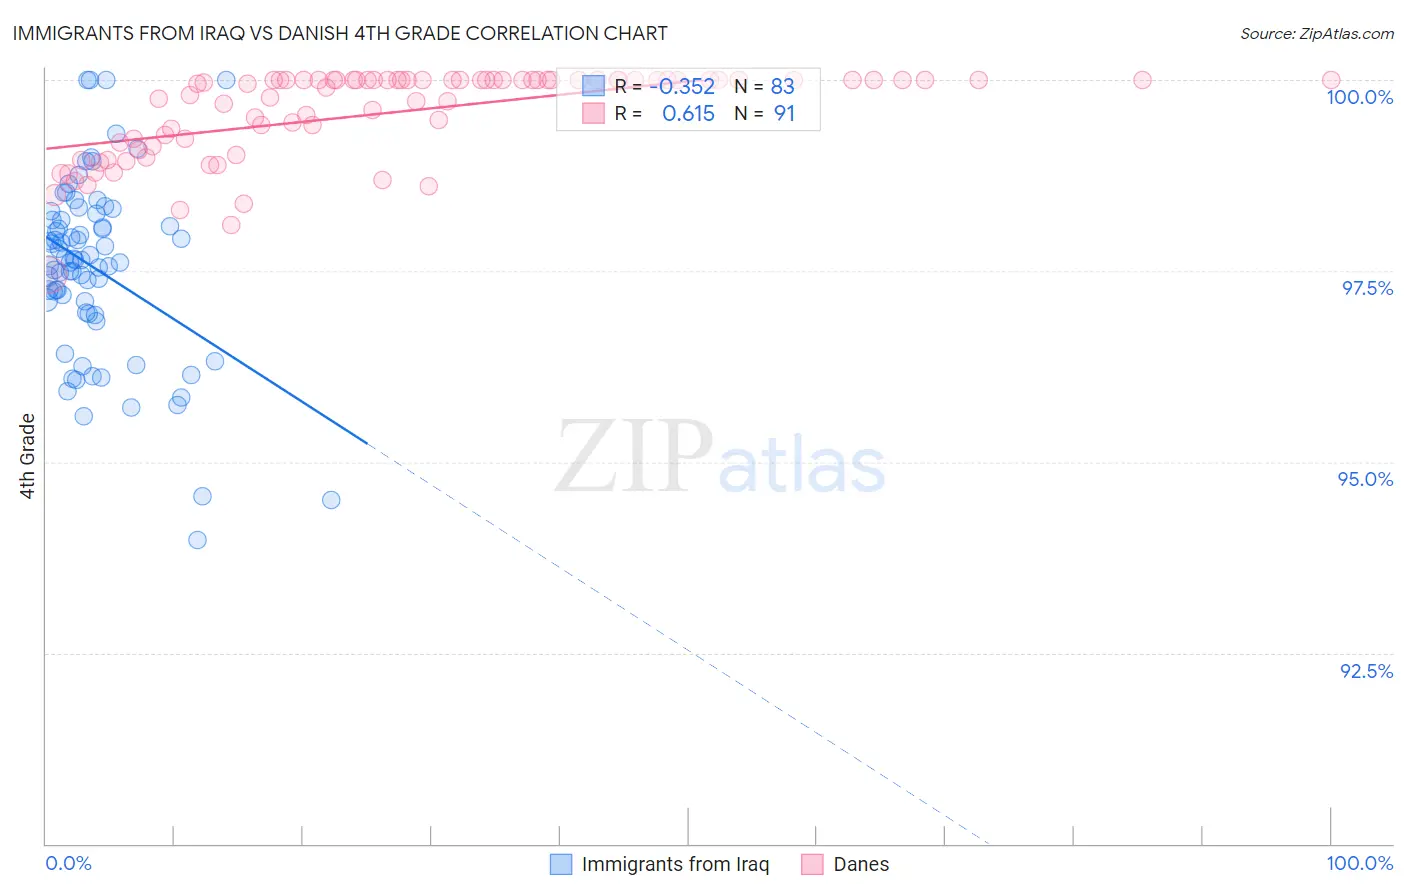
Immigrants from Iraq vs Danish 4th Grade Correlation Chart
The statistical analysis conducted on geographies consisting of 194,632,332 people shows a mild negative correlation between the proportion of Immigrants from Iraq and percentage of population with at least 4th grade education in the United States with a correlation coefficient (R) of -0.352 and weighted average of 97.2%. Similarly, the statistical analysis conducted on geographies consisting of 474,193,610 people shows a significant positive correlation between the proportion of Danes and percentage of population with at least 4th grade education in the United States with a correlation coefficient (R) of 0.615 and weighted average of 98.3%, a difference of 1.1%.
4th Grade Correlation Summary
| Measurement | Immigrants from Iraq | Danish |
| Minimum | 94.0% | 97.4% |
| Maximum | 100.0% | 100.0% |
| Range | 6.0% | 2.6% |
| Mean | 97.5% | 99.6% |
| Median | 97.6% | 100.0% |
| Interquartile 25% (IQ1) | 97.0% | 99.1% |
| Interquartile 75% (IQ3) | 98.2% | 100.0% |
| Interquartile Range (IQR) | 1.2% | 0.87% |
| Standard Deviation (Sample) | 1.2% | 0.58% |
| Standard Deviation (Population) | 1.2% | 0.58% |
Similar Demographics by 4th Grade
Demographics Similar to Immigrants from Iraq by 4th Grade
In terms of 4th grade, the demographic groups most similar to Immigrants from Iraq are Immigrants from Lebanon (97.3%, a difference of 0.010%), Immigrants from Sudan (97.2%, a difference of 0.010%), Immigrants from Syria (97.2%, a difference of 0.010%), Tongan (97.3%, a difference of 0.020%), and South American Indian (97.3%, a difference of 0.020%).
| Demographics | Rating | Rank | 4th Grade |
| Iraqis | 6.3 /100 | #218 | Tragic 97.3% |
| Tongans | 5.8 /100 | #219 | Tragic 97.3% |
| South American Indians | 5.5 /100 | #220 | Tragic 97.3% |
| Immigrants | Panama | 5.4 /100 | #221 | Tragic 97.3% |
| Immigrants | Lebanon | 5.1 /100 | #222 | Tragic 97.3% |
| Immigrants | Sudan | 5.0 /100 | #223 | Tragic 97.2% |
| Immigrants | Syria | 5.0 /100 | #224 | Tragic 97.2% |
| Immigrants | Iraq | 4.6 /100 | #225 | Tragic 97.2% |
| Bahamians | 3.8 /100 | #226 | Tragic 97.2% |
| Immigrants | Pakistan | 3.7 /100 | #227 | Tragic 97.2% |
| Sub-Saharan Africans | 3.6 /100 | #228 | Tragic 97.2% |
| Liberians | 3.6 /100 | #229 | Tragic 97.2% |
| Uruguayans | 3.5 /100 | #230 | Tragic 97.2% |
| Immigrants | Malaysia | 3.4 /100 | #231 | Tragic 97.2% |
| Immigrants | Western Asia | 3.4 /100 | #232 | Tragic 97.2% |
Demographics Similar to Danes by 4th Grade
In terms of 4th grade, the demographic groups most similar to Danes are Sioux (98.3%, a difference of 0.010%), Scotch-Irish (98.3%, a difference of 0.010%), Croatian (98.3%, a difference of 0.010%), Lithuanian (98.3%, a difference of 0.020%), and Finnish (98.3%, a difference of 0.020%).
| Demographics | Rating | Rank | 4th Grade |
| Pennsylvania Germans | 100.0 /100 | #17 | Exceptional 98.4% |
| Poles | 100.0 /100 | #18 | Exceptional 98.4% |
| Irish | 100.0 /100 | #19 | Exceptional 98.4% |
| Alaska Natives | 100.0 /100 | #20 | Exceptional 98.4% |
| Lithuanians | 100.0 /100 | #21 | Exceptional 98.3% |
| Finns | 100.0 /100 | #22 | Exceptional 98.3% |
| Sioux | 100.0 /100 | #23 | Exceptional 98.3% |
| Danes | 100.0 /100 | #24 | Exceptional 98.3% |
| Scotch-Irish | 100.0 /100 | #25 | Exceptional 98.3% |
| Croatians | 100.0 /100 | #26 | Exceptional 98.3% |
| French Canadians | 100.0 /100 | #27 | Exceptional 98.3% |
| French | 100.0 /100 | #28 | Exceptional 98.3% |
| Czechs | 100.0 /100 | #29 | Exceptional 98.3% |
| Scandinavians | 100.0 /100 | #30 | Exceptional 98.3% |
| Europeans | 100.0 /100 | #31 | Exceptional 98.3% |