Immigrants from North Macedonia vs Icelander 4th Grade
COMPARE
Immigrants from North Macedonia
Icelander
4th Grade
4th Grade Comparison
Immigrants from North Macedonia
Icelanders
97.7%
4TH GRADE
83.3/ 100
METRIC RATING
142nd/ 347
METRIC RANK
98.0%
4TH GRADE
99.1/ 100
METRIC RATING
82nd/ 347
METRIC RANK
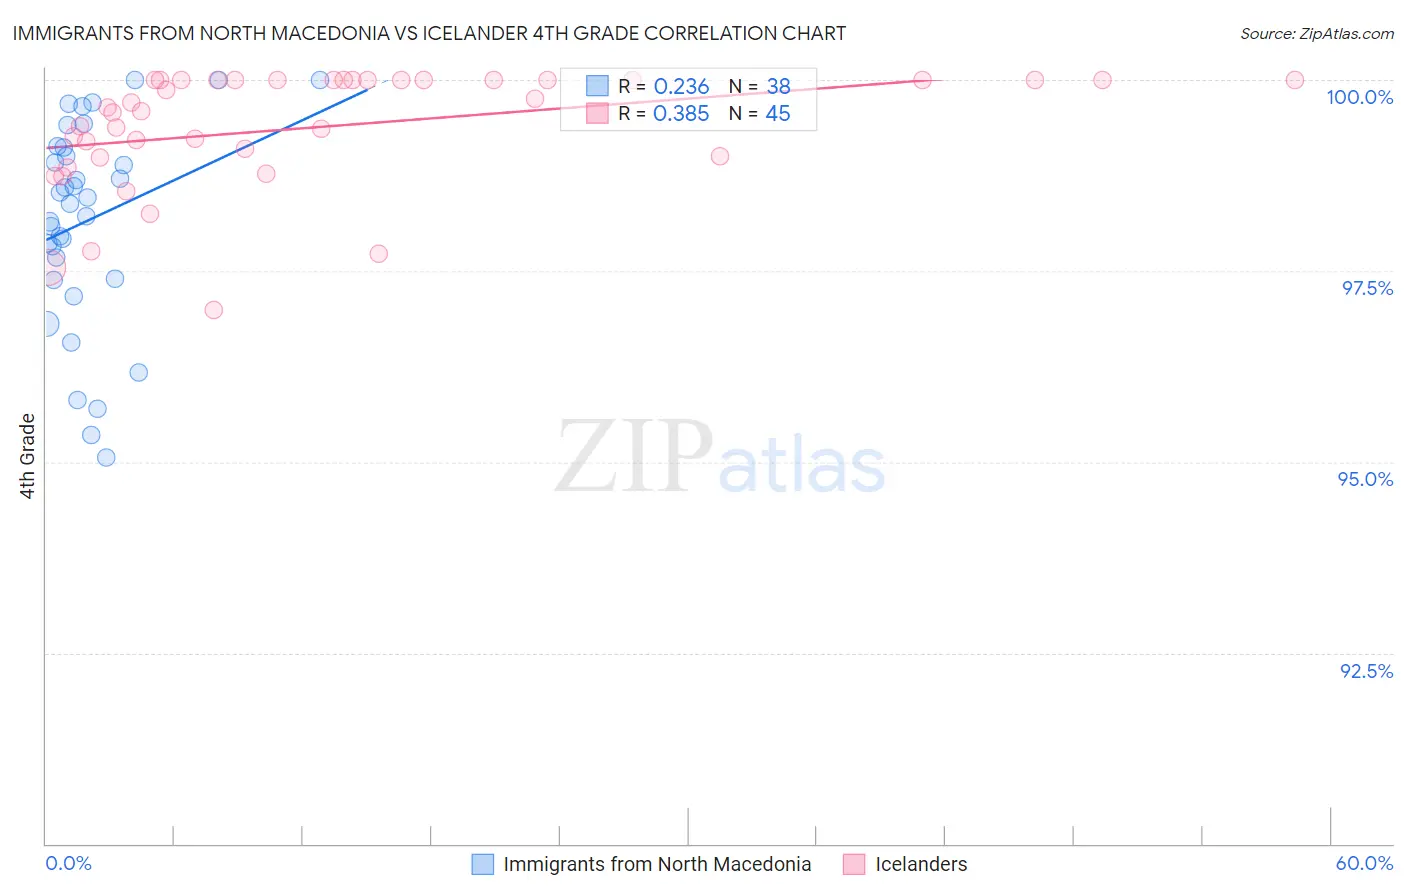
Immigrants from North Macedonia vs Icelander 4th Grade Correlation Chart
The statistical analysis conducted on geographies consisting of 74,317,186 people shows a weak positive correlation between the proportion of Immigrants from North Macedonia and percentage of population with at least 4th grade education in the United States with a correlation coefficient (R) of 0.236 and weighted average of 97.7%. Similarly, the statistical analysis conducted on geographies consisting of 159,668,748 people shows a mild positive correlation between the proportion of Icelanders and percentage of population with at least 4th grade education in the United States with a correlation coefficient (R) of 0.385 and weighted average of 98.0%, a difference of 0.29%.
4th Grade Correlation Summary
| Measurement | Immigrants from North Macedonia | Icelander |
| Minimum | 95.1% | 97.0% |
| Maximum | 100.0% | 100.0% |
| Range | 4.9% | 3.0% |
| Mean | 98.2% | 99.4% |
| Median | 98.4% | 99.6% |
| Interquartile 25% (IQ1) | 97.4% | 99.0% |
| Interquartile 75% (IQ3) | 99.1% | 100.0% |
| Interquartile Range (IQR) | 1.7% | 1.0% |
| Standard Deviation (Sample) | 1.3% | 0.77% |
| Standard Deviation (Population) | 1.3% | 0.76% |
Similar Demographics by 4th Grade
Demographics Similar to Immigrants from North Macedonia by 4th Grade
In terms of 4th grade, the demographic groups most similar to Immigrants from North Macedonia are Immigrants from Greece (97.7%, a difference of 0.0%), Burmese (97.7%, a difference of 0.0%), Spaniard (97.7%, a difference of 0.0%), Seminole (97.7%, a difference of 0.010%), and Filipino (97.7%, a difference of 0.010%).
| Demographics | Rating | Rank | 4th Grade |
| Cambodians | 87.8 /100 | #135 | Excellent 97.7% |
| Israelis | 86.2 /100 | #136 | Excellent 97.7% |
| Immigrants | Turkey | 86.0 /100 | #137 | Excellent 97.7% |
| Blackfeet | 86.0 /100 | #138 | Excellent 97.7% |
| Seminole | 84.7 /100 | #139 | Excellent 97.7% |
| Filipinos | 84.0 /100 | #140 | Excellent 97.7% |
| Immigrants | Greece | 83.8 /100 | #141 | Excellent 97.7% |
| Immigrants | North Macedonia | 83.3 /100 | #142 | Excellent 97.7% |
| Burmese | 82.8 /100 | #143 | Excellent 97.7% |
| Spaniards | 82.7 /100 | #144 | Excellent 97.7% |
| Immigrants | Moldova | 82.4 /100 | #145 | Excellent 97.7% |
| Jordanians | 81.3 /100 | #146 | Excellent 97.7% |
| Ute | 80.6 /100 | #147 | Excellent 97.7% |
| Hopi | 80.6 /100 | #148 | Excellent 97.7% |
| Soviet Union | 77.8 /100 | #149 | Good 97.6% |
Demographics Similar to Icelanders by 4th Grade
In terms of 4th grade, the demographic groups most similar to Icelanders are Immigrants from India (98.0%, a difference of 0.0%), Ukrainian (98.0%, a difference of 0.010%), Osage (98.0%, a difference of 0.010%), Immigrants from Belgium (97.9%, a difference of 0.010%), and Cherokee (98.0%, a difference of 0.020%).
| Demographics | Rating | Rank | 4th Grade |
| Immigrants | Netherlands | 99.3 /100 | #75 | Exceptional 98.0% |
| Cherokee | 99.3 /100 | #76 | Exceptional 98.0% |
| Immigrants | Lithuania | 99.3 /100 | #77 | Exceptional 98.0% |
| Immigrants | England | 99.3 /100 | #78 | Exceptional 98.0% |
| Ukrainians | 99.2 /100 | #79 | Exceptional 98.0% |
| Osage | 99.2 /100 | #80 | Exceptional 98.0% |
| Immigrants | India | 99.1 /100 | #81 | Exceptional 98.0% |
| Icelanders | 99.1 /100 | #82 | Exceptional 98.0% |
| Immigrants | Belgium | 99.0 /100 | #83 | Exceptional 97.9% |
| Cypriots | 98.9 /100 | #84 | Exceptional 97.9% |
| Potawatomi | 98.9 /100 | #85 | Exceptional 97.9% |
| Immigrants | Australia | 98.8 /100 | #86 | Exceptional 97.9% |
| Zimbabweans | 98.8 /100 | #87 | Exceptional 97.9% |
| Immigrants | South Africa | 98.8 /100 | #88 | Exceptional 97.9% |
| Delaware | 98.8 /100 | #89 | Exceptional 97.9% |