Immigrants from Chile vs Danish 4th Grade
COMPARE
Immigrants from Chile
Danish
4th Grade
4th Grade Comparison
Immigrants from Chile
Danes
97.4%
4TH GRADE
16.1/ 100
METRIC RATING
202nd/ 347
METRIC RANK
98.3%
4TH GRADE
100.0/ 100
METRIC RATING
24th/ 347
METRIC RANK
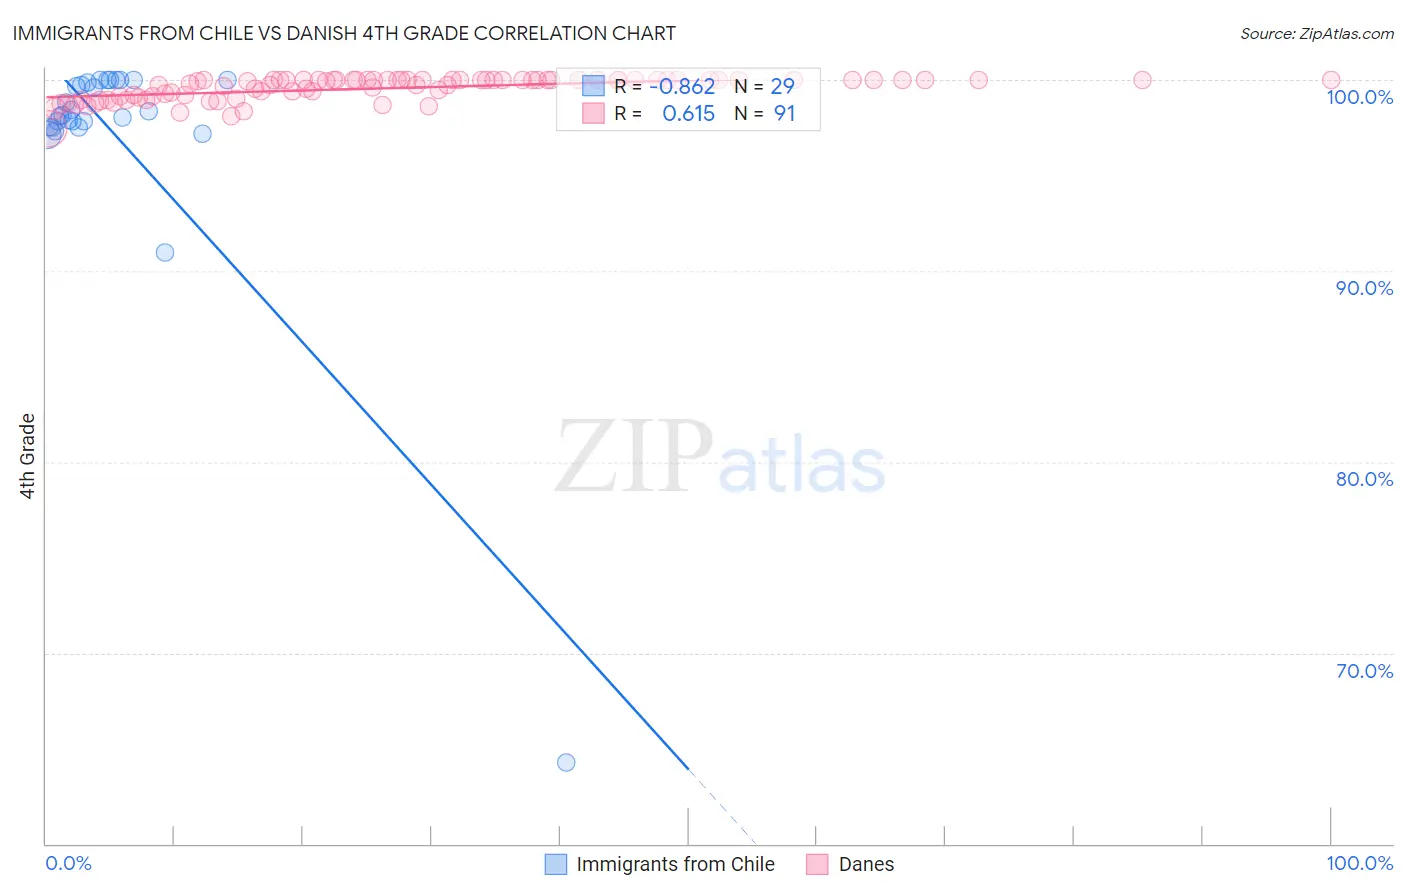
Immigrants from Chile vs Danish 4th Grade Correlation Chart
The statistical analysis conducted on geographies consisting of 218,647,266 people shows a very strong negative correlation between the proportion of Immigrants from Chile and percentage of population with at least 4th grade education in the United States with a correlation coefficient (R) of -0.862 and weighted average of 97.4%. Similarly, the statistical analysis conducted on geographies consisting of 474,193,610 people shows a significant positive correlation between the proportion of Danes and percentage of population with at least 4th grade education in the United States with a correlation coefficient (R) of 0.615 and weighted average of 98.3%, a difference of 0.98%.
4th Grade Correlation Summary
| Measurement | Immigrants from Chile | Danish |
| Minimum | 64.3% | 97.4% |
| Maximum | 100.0% | 100.0% |
| Range | 35.7% | 2.6% |
| Mean | 97.2% | 99.6% |
| Median | 98.1% | 100.0% |
| Interquartile 25% (IQ1) | 97.5% | 99.1% |
| Interquartile 75% (IQ3) | 99.9% | 100.0% |
| Interquartile Range (IQR) | 2.4% | 0.87% |
| Standard Deviation (Sample) | 6.6% | 0.58% |
| Standard Deviation (Population) | 6.5% | 0.58% |
Similar Demographics by 4th Grade
Demographics Similar to Immigrants from Chile by 4th Grade
In terms of 4th grade, the demographic groups most similar to Immigrants from Chile are Immigrants from Southern Europe (97.4%, a difference of 0.0%), Immigrants from Northern Africa (97.4%, a difference of 0.010%), African (97.4%, a difference of 0.010%), Immigrants from Uganda (97.4%, a difference of 0.020%), and Paiute (97.3%, a difference of 0.020%).
| Demographics | Rating | Rank | 4th Grade |
| Paraguayans | 28.9 /100 | #195 | Fair 97.4% |
| Immigrants | Albania | 27.7 /100 | #196 | Fair 97.4% |
| Hawaiians | 25.6 /100 | #197 | Fair 97.4% |
| Guamanians/Chamorros | 23.0 /100 | #198 | Fair 97.4% |
| Natives/Alaskans | 20.6 /100 | #199 | Fair 97.4% |
| Immigrants | Uganda | 19.8 /100 | #200 | Poor 97.4% |
| Immigrants | Southern Europe | 16.2 /100 | #201 | Poor 97.4% |
| Immigrants | Chile | 16.1 /100 | #202 | Poor 97.4% |
| Immigrants | Northern Africa | 15.1 /100 | #203 | Poor 97.4% |
| Africans | 14.6 /100 | #204 | Poor 97.4% |
| Paiute | 13.2 /100 | #205 | Poor 97.3% |
| Immigrants | Zaire | 12.8 /100 | #206 | Poor 97.3% |
| Moroccans | 11.3 /100 | #207 | Poor 97.3% |
| Immigrants | Bahamas | 10.8 /100 | #208 | Poor 97.3% |
| Laotians | 9.3 /100 | #209 | Tragic 97.3% |
Demographics Similar to Danes by 4th Grade
In terms of 4th grade, the demographic groups most similar to Danes are Sioux (98.3%, a difference of 0.010%), Scotch-Irish (98.3%, a difference of 0.010%), Croatian (98.3%, a difference of 0.010%), Lithuanian (98.3%, a difference of 0.020%), and Finnish (98.3%, a difference of 0.020%).
| Demographics | Rating | Rank | 4th Grade |
| Pennsylvania Germans | 100.0 /100 | #17 | Exceptional 98.4% |
| Poles | 100.0 /100 | #18 | Exceptional 98.4% |
| Irish | 100.0 /100 | #19 | Exceptional 98.4% |
| Alaska Natives | 100.0 /100 | #20 | Exceptional 98.4% |
| Lithuanians | 100.0 /100 | #21 | Exceptional 98.3% |
| Finns | 100.0 /100 | #22 | Exceptional 98.3% |
| Sioux | 100.0 /100 | #23 | Exceptional 98.3% |
| Danes | 100.0 /100 | #24 | Exceptional 98.3% |
| Scotch-Irish | 100.0 /100 | #25 | Exceptional 98.3% |
| Croatians | 100.0 /100 | #26 | Exceptional 98.3% |
| French Canadians | 100.0 /100 | #27 | Exceptional 98.3% |
| French | 100.0 /100 | #28 | Exceptional 98.3% |
| Czechs | 100.0 /100 | #29 | Exceptional 98.3% |
| Scandinavians | 100.0 /100 | #30 | Exceptional 98.3% |
| Europeans | 100.0 /100 | #31 | Exceptional 98.3% |