Immigrants from Nigeria vs Immigrants from Lithuania Doctorate Degree
COMPARE
Immigrants from Nigeria
Immigrants from Lithuania
Doctorate Degree
Doctorate Degree Comparison
Immigrants from Nigeria
Immigrants from Lithuania
1.8%
DOCTORATE DEGREE
22.4/ 100
METRIC RATING
201st/ 347
METRIC RANK
2.2%
DOCTORATE DEGREE
99.6/ 100
METRIC RATING
83rd/ 347
METRIC RANK
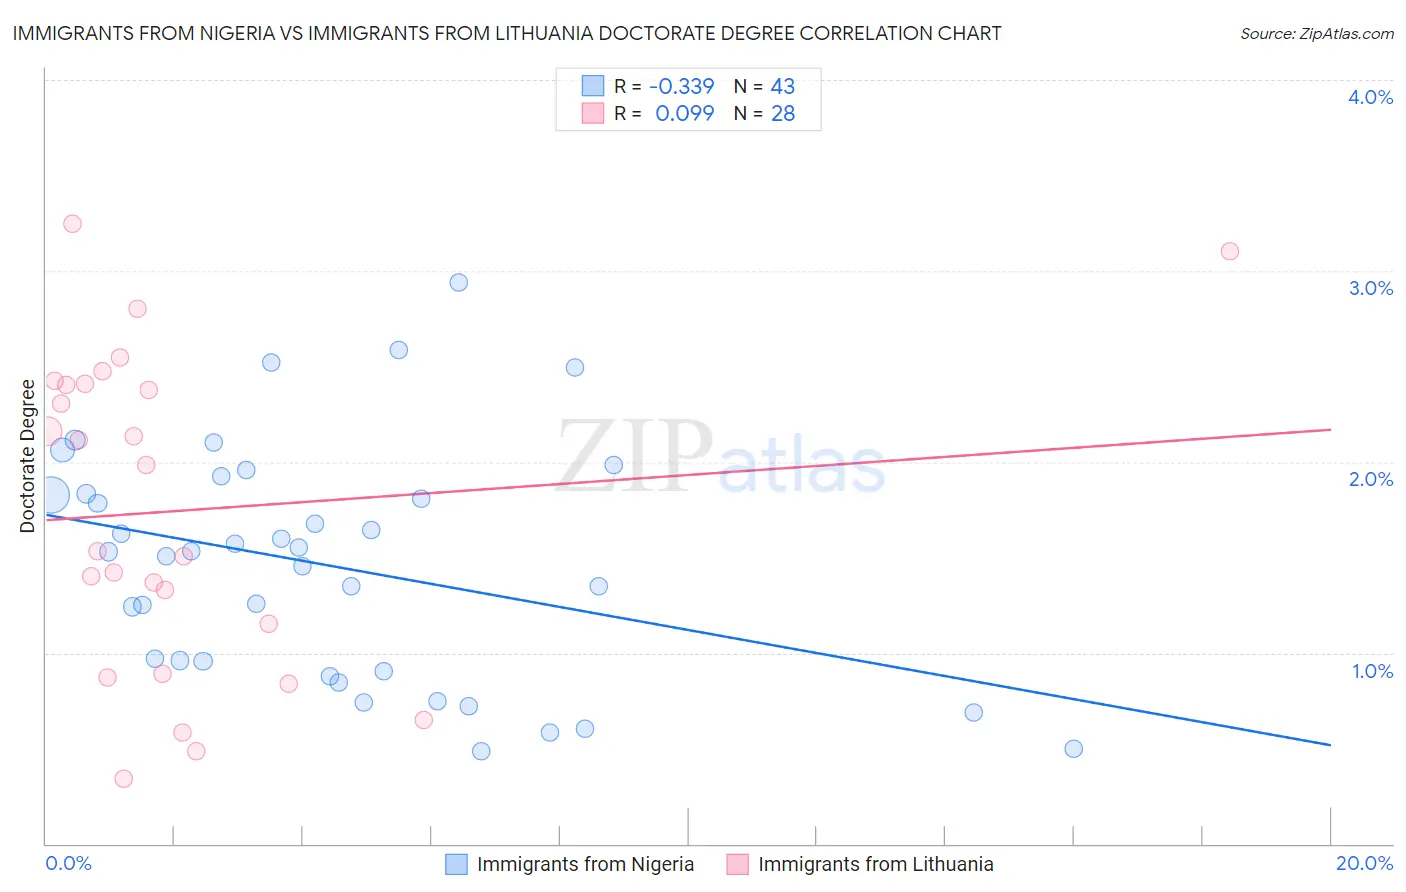
Immigrants from Nigeria vs Immigrants from Lithuania Doctorate Degree Correlation Chart
The statistical analysis conducted on geographies consisting of 282,146,765 people shows a mild negative correlation between the proportion of Immigrants from Nigeria and percentage of population with at least doctorate degree education in the United States with a correlation coefficient (R) of -0.339 and weighted average of 1.8%. Similarly, the statistical analysis conducted on geographies consisting of 117,578,099 people shows a slight positive correlation between the proportion of Immigrants from Lithuania and percentage of population with at least doctorate degree education in the United States with a correlation coefficient (R) of 0.099 and weighted average of 2.2%, a difference of 25.9%.
Doctorate Degree Correlation Summary
| Measurement | Immigrants from Nigeria | Immigrants from Lithuania |
| Minimum | 0.48% | 0.34% |
| Maximum | 2.9% | 3.2% |
| Range | 2.5% | 2.9% |
| Mean | 1.5% | 1.7% |
| Median | 1.5% | 1.8% |
| Interquartile 25% (IQ1) | 0.90% | 1.0% |
| Interquartile 75% (IQ3) | 1.8% | 2.4% |
| Interquartile Range (IQR) | 0.93% | 1.4% |
| Standard Deviation (Sample) | 0.61% | 0.82% |
| Standard Deviation (Population) | 0.61% | 0.81% |
Similar Demographics by Doctorate Degree
Demographics Similar to Immigrants from Nigeria by Doctorate Degree
In terms of doctorate degree, the demographic groups most similar to Immigrants from Nigeria are White/Caucasian (1.8%, a difference of 0.070%), Immigrants from South America (1.8%, a difference of 0.18%), Portuguese (1.8%, a difference of 0.23%), Immigrants from Vietnam (1.8%, a difference of 0.25%), and Somali (1.7%, a difference of 0.28%).
| Demographics | Rating | Rank | Doctorate Degree |
| Uruguayans | 26.2 /100 | #194 | Fair 1.8% |
| Immigrants | Somalia | 25.4 /100 | #195 | Fair 1.8% |
| Sub-Saharan Africans | 25.1 /100 | #196 | Fair 1.8% |
| Chinese | 25.1 /100 | #197 | Fair 1.8% |
| Immigrants | Ghana | 24.6 /100 | #198 | Fair 1.8% |
| Immigrants | South America | 23.3 /100 | #199 | Fair 1.8% |
| Whites/Caucasians | 22.8 /100 | #200 | Fair 1.8% |
| Immigrants | Nigeria | 22.4 /100 | #201 | Fair 1.8% |
| Portuguese | 21.4 /100 | #202 | Fair 1.8% |
| Immigrants | Vietnam | 21.4 /100 | #203 | Fair 1.8% |
| Somalis | 21.2 /100 | #204 | Fair 1.7% |
| Venezuelans | 19.5 /100 | #205 | Poor 1.7% |
| Immigrants | Peru | 17.6 /100 | #206 | Poor 1.7% |
| Yugoslavians | 17.1 /100 | #207 | Poor 1.7% |
| Colombians | 16.1 /100 | #208 | Poor 1.7% |
Demographics Similar to Immigrants from Lithuania by Doctorate Degree
In terms of doctorate degree, the demographic groups most similar to Immigrants from Lithuania are Immigrants from England (2.2%, a difference of 0.14%), Immigrants from Uganda (2.2%, a difference of 0.17%), Immigrants from Brazil (2.2%, a difference of 0.27%), Immigrants from Argentina (2.2%, a difference of 0.71%), and Ugandan (2.2%, a difference of 0.77%).
| Demographics | Rating | Rank | Doctorate Degree |
| Immigrants | Hungary | 99.8 /100 | #76 | Exceptional 2.2% |
| Immigrants | Lebanon | 99.8 /100 | #77 | Exceptional 2.2% |
| Immigrants | Belarus | 99.7 /100 | #78 | Exceptional 2.2% |
| Northern Europeans | 99.7 /100 | #79 | Exceptional 2.2% |
| Ugandans | 99.7 /100 | #80 | Exceptional 2.2% |
| Immigrants | Argentina | 99.7 /100 | #81 | Exceptional 2.2% |
| Immigrants | Uganda | 99.6 /100 | #82 | Exceptional 2.2% |
| Immigrants | Lithuania | 99.6 /100 | #83 | Exceptional 2.2% |
| Immigrants | England | 99.6 /100 | #84 | Exceptional 2.2% |
| Immigrants | Brazil | 99.6 /100 | #85 | Exceptional 2.2% |
| Egyptians | 99.4 /100 | #86 | Exceptional 2.2% |
| Immigrants | Zimbabwe | 99.4 /100 | #87 | Exceptional 2.2% |
| Immigrants | Nepal | 99.3 /100 | #88 | Exceptional 2.2% |
| British | 99.3 /100 | #89 | Exceptional 2.2% |
| Immigrants | Scotland | 99.2 /100 | #90 | Exceptional 2.2% |