Immigrants from Nigeria vs Immigrants from Dominica Doctorate Degree
COMPARE
Immigrants from Nigeria
Immigrants from Dominica
Doctorate Degree
Doctorate Degree Comparison
Immigrants from Nigeria
Immigrants from Dominica
1.8%
DOCTORATE DEGREE
22.4/ 100
METRIC RATING
201st/ 347
METRIC RANK
1.4%
DOCTORATE DEGREE
0.1/ 100
METRIC RATING
303rd/ 347
METRIC RANK
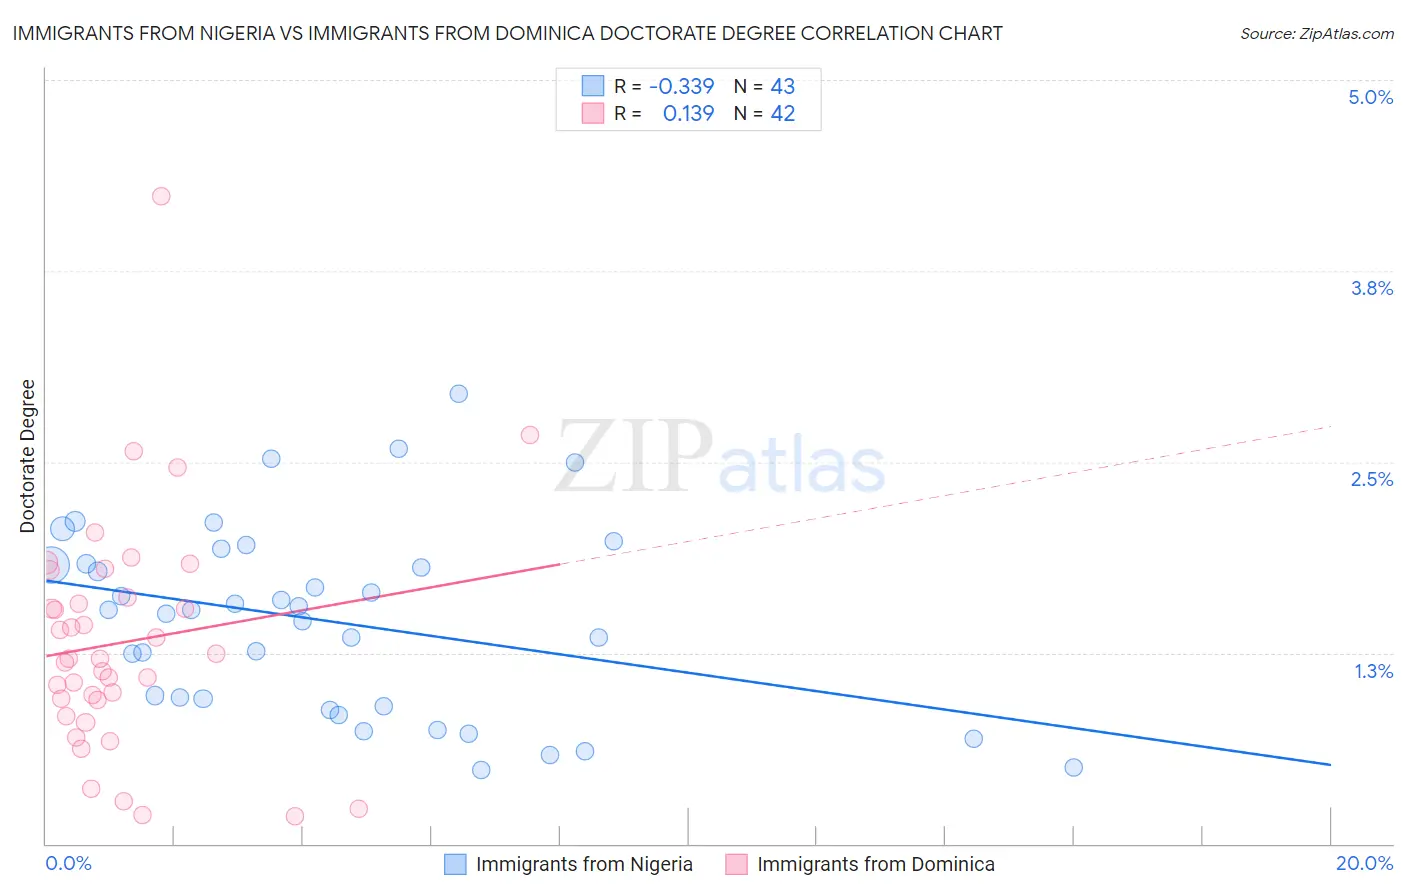
Immigrants from Nigeria vs Immigrants from Dominica Doctorate Degree Correlation Chart
The statistical analysis conducted on geographies consisting of 282,146,765 people shows a mild negative correlation between the proportion of Immigrants from Nigeria and percentage of population with at least doctorate degree education in the United States with a correlation coefficient (R) of -0.339 and weighted average of 1.8%. Similarly, the statistical analysis conducted on geographies consisting of 83,662,569 people shows a poor positive correlation between the proportion of Immigrants from Dominica and percentage of population with at least doctorate degree education in the United States with a correlation coefficient (R) of 0.139 and weighted average of 1.4%, a difference of 26.9%.
Doctorate Degree Correlation Summary
| Measurement | Immigrants from Nigeria | Immigrants from Dominica |
| Minimum | 0.48% | 0.18% |
| Maximum | 2.9% | 4.2% |
| Range | 2.5% | 4.1% |
| Mean | 1.5% | 1.3% |
| Median | 1.5% | 1.2% |
| Interquartile 25% (IQ1) | 0.90% | 0.94% |
| Interquartile 75% (IQ3) | 1.8% | 1.6% |
| Interquartile Range (IQR) | 0.93% | 0.67% |
| Standard Deviation (Sample) | 0.61% | 0.76% |
| Standard Deviation (Population) | 0.61% | 0.75% |
Similar Demographics by Doctorate Degree
Demographics Similar to Immigrants from Nigeria by Doctorate Degree
In terms of doctorate degree, the demographic groups most similar to Immigrants from Nigeria are White/Caucasian (1.8%, a difference of 0.070%), Immigrants from South America (1.8%, a difference of 0.18%), Portuguese (1.8%, a difference of 0.23%), Immigrants from Vietnam (1.8%, a difference of 0.25%), and Somali (1.7%, a difference of 0.28%).
| Demographics | Rating | Rank | Doctorate Degree |
| Uruguayans | 26.2 /100 | #194 | Fair 1.8% |
| Immigrants | Somalia | 25.4 /100 | #195 | Fair 1.8% |
| Sub-Saharan Africans | 25.1 /100 | #196 | Fair 1.8% |
| Chinese | 25.1 /100 | #197 | Fair 1.8% |
| Immigrants | Ghana | 24.6 /100 | #198 | Fair 1.8% |
| Immigrants | South America | 23.3 /100 | #199 | Fair 1.8% |
| Whites/Caucasians | 22.8 /100 | #200 | Fair 1.8% |
| Immigrants | Nigeria | 22.4 /100 | #201 | Fair 1.8% |
| Portuguese | 21.4 /100 | #202 | Fair 1.8% |
| Immigrants | Vietnam | 21.4 /100 | #203 | Fair 1.8% |
| Somalis | 21.2 /100 | #204 | Fair 1.7% |
| Venezuelans | 19.5 /100 | #205 | Poor 1.7% |
| Immigrants | Peru | 17.6 /100 | #206 | Poor 1.7% |
| Yugoslavians | 17.1 /100 | #207 | Poor 1.7% |
| Colombians | 16.1 /100 | #208 | Poor 1.7% |
Demographics Similar to Immigrants from Dominica by Doctorate Degree
In terms of doctorate degree, the demographic groups most similar to Immigrants from Dominica are Shoshone (1.4%, a difference of 0.030%), Mexican American Indian (1.4%, a difference of 0.060%), Pennsylvania German (1.4%, a difference of 0.19%), Guyanese (1.4%, a difference of 0.20%), and Honduran (1.4%, a difference of 0.36%).
| Demographics | Rating | Rank | Doctorate Degree |
| Immigrants | Ecuador | 0.2 /100 | #296 | Tragic 1.4% |
| Tsimshian | 0.2 /100 | #297 | Tragic 1.4% |
| Puerto Ricans | 0.1 /100 | #298 | Tragic 1.4% |
| Belizeans | 0.1 /100 | #299 | Tragic 1.4% |
| Immigrants | Guatemala | 0.1 /100 | #300 | Tragic 1.4% |
| Hondurans | 0.1 /100 | #301 | Tragic 1.4% |
| Shoshone | 0.1 /100 | #302 | Tragic 1.4% |
| Immigrants | Dominica | 0.1 /100 | #303 | Tragic 1.4% |
| Mexican American Indians | 0.1 /100 | #304 | Tragic 1.4% |
| Pennsylvania Germans | 0.1 /100 | #305 | Tragic 1.4% |
| Guyanese | 0.1 /100 | #306 | Tragic 1.4% |
| Cubans | 0.1 /100 | #307 | Tragic 1.4% |
| Immigrants | Laos | 0.1 /100 | #308 | Tragic 1.4% |
| Immigrants | Grenada | 0.1 /100 | #309 | Tragic 1.4% |
| Immigrants | Jamaica | 0.1 /100 | #310 | Tragic 1.4% |