Australian vs Immigrants from Lithuania Doctorate Degree
COMPARE
Australian
Immigrants from Lithuania
Doctorate Degree
Doctorate Degree Comparison
Australians
Immigrants from Lithuania
2.4%
DOCTORATE DEGREE
100.0/ 100
METRIC RATING
51st/ 347
METRIC RANK
2.2%
DOCTORATE DEGREE
99.6/ 100
METRIC RATING
83rd/ 347
METRIC RANK
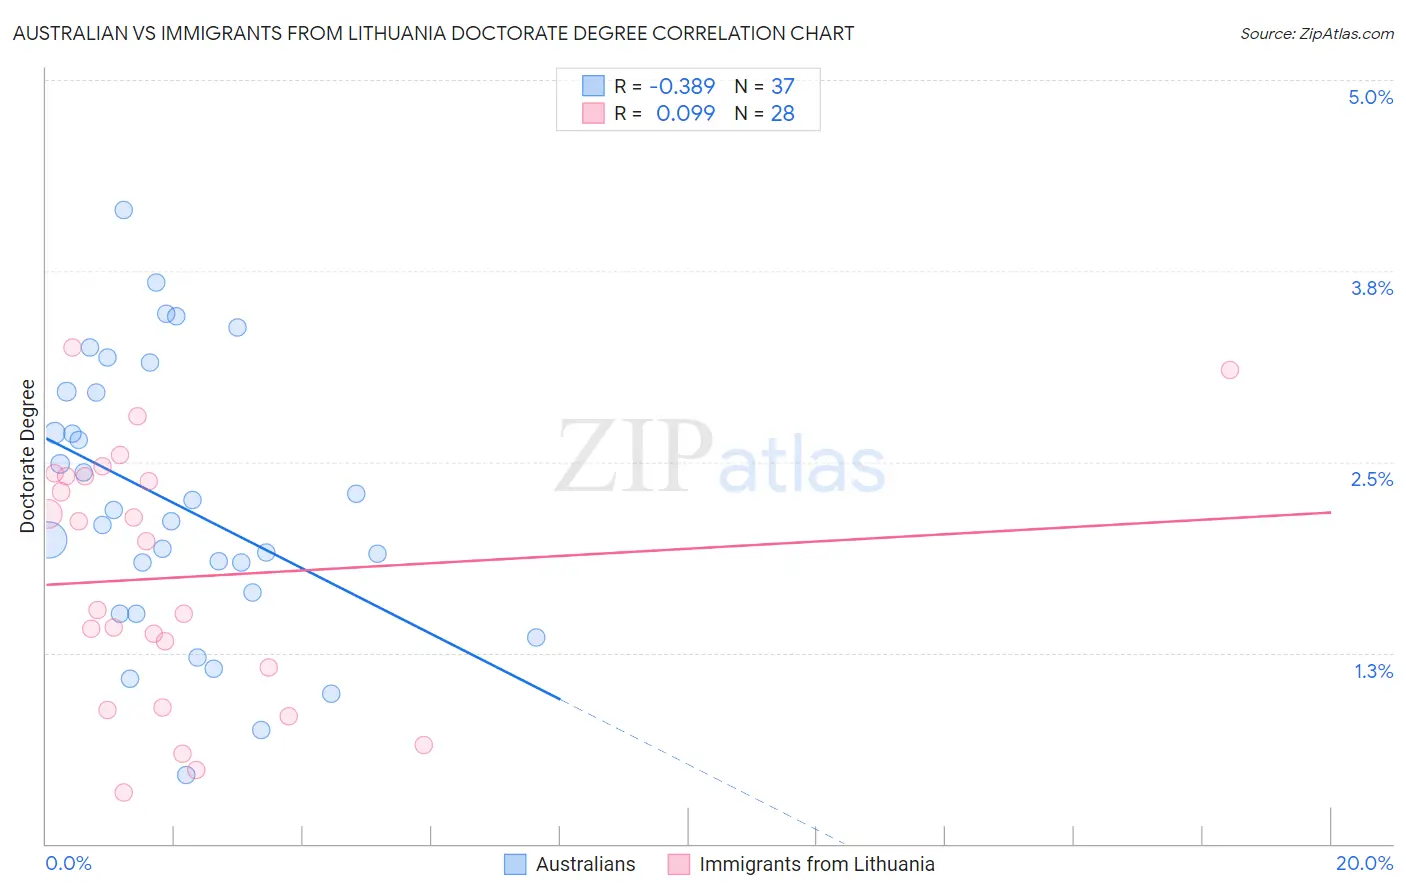
Australian vs Immigrants from Lithuania Doctorate Degree Correlation Chart
The statistical analysis conducted on geographies consisting of 223,128,872 people shows a mild negative correlation between the proportion of Australians and percentage of population with at least doctorate degree education in the United States with a correlation coefficient (R) of -0.389 and weighted average of 2.4%. Similarly, the statistical analysis conducted on geographies consisting of 117,578,099 people shows a slight positive correlation between the proportion of Immigrants from Lithuania and percentage of population with at least doctorate degree education in the United States with a correlation coefficient (R) of 0.099 and weighted average of 2.2%, a difference of 8.5%.
Doctorate Degree Correlation Summary
| Measurement | Australian | Immigrants from Lithuania |
| Minimum | 0.45% | 0.34% |
| Maximum | 4.2% | 3.2% |
| Range | 3.7% | 2.9% |
| Mean | 2.2% | 1.7% |
| Median | 2.1% | 1.8% |
| Interquartile 25% (IQ1) | 1.6% | 1.0% |
| Interquartile 75% (IQ3) | 3.0% | 2.4% |
| Interquartile Range (IQR) | 1.4% | 1.4% |
| Standard Deviation (Sample) | 0.88% | 0.82% |
| Standard Deviation (Population) | 0.87% | 0.81% |
Similar Demographics by Doctorate Degree
Demographics Similar to Australians by Doctorate Degree
In terms of doctorate degree, the demographic groups most similar to Australians are Immigrants from Norway (2.4%, a difference of 0.090%), Bulgarian (2.4%, a difference of 0.47%), Immigrants from Latvia (2.4%, a difference of 0.59%), Immigrants from Asia (2.4%, a difference of 1.2%), and Immigrants from Indonesia (2.4%, a difference of 1.3%).
| Demographics | Rating | Rank | Doctorate Degree |
| Immigrants | Netherlands | 100.0 /100 | #44 | Exceptional 2.5% |
| Immigrants | South Africa | 100.0 /100 | #45 | Exceptional 2.4% |
| Immigrants | Austria | 100.0 /100 | #46 | Exceptional 2.4% |
| Immigrants | Western Europe | 100.0 /100 | #47 | Exceptional 2.4% |
| Asians | 100.0 /100 | #48 | Exceptional 2.4% |
| Immigrants | Asia | 100.0 /100 | #49 | Exceptional 2.4% |
| Immigrants | Norway | 100.0 /100 | #50 | Exceptional 2.4% |
| Australians | 100.0 /100 | #51 | Exceptional 2.4% |
| Bulgarians | 100.0 /100 | #52 | Exceptional 2.4% |
| Immigrants | Latvia | 100.0 /100 | #53 | Exceptional 2.4% |
| Immigrants | Indonesia | 100.0 /100 | #54 | Exceptional 2.4% |
| Bolivians | 100.0 /100 | #55 | Exceptional 2.4% |
| Immigrants | Czechoslovakia | 100.0 /100 | #56 | Exceptional 2.4% |
| Immigrants | Ethiopia | 100.0 /100 | #57 | Exceptional 2.4% |
| Ethiopians | 99.9 /100 | #58 | Exceptional 2.3% |
Demographics Similar to Immigrants from Lithuania by Doctorate Degree
In terms of doctorate degree, the demographic groups most similar to Immigrants from Lithuania are Immigrants from England (2.2%, a difference of 0.14%), Immigrants from Uganda (2.2%, a difference of 0.17%), Immigrants from Brazil (2.2%, a difference of 0.27%), Immigrants from Argentina (2.2%, a difference of 0.71%), and Ugandan (2.2%, a difference of 0.77%).
| Demographics | Rating | Rank | Doctorate Degree |
| Immigrants | Hungary | 99.8 /100 | #76 | Exceptional 2.2% |
| Immigrants | Lebanon | 99.8 /100 | #77 | Exceptional 2.2% |
| Immigrants | Belarus | 99.7 /100 | #78 | Exceptional 2.2% |
| Northern Europeans | 99.7 /100 | #79 | Exceptional 2.2% |
| Ugandans | 99.7 /100 | #80 | Exceptional 2.2% |
| Immigrants | Argentina | 99.7 /100 | #81 | Exceptional 2.2% |
| Immigrants | Uganda | 99.6 /100 | #82 | Exceptional 2.2% |
| Immigrants | Lithuania | 99.6 /100 | #83 | Exceptional 2.2% |
| Immigrants | England | 99.6 /100 | #84 | Exceptional 2.2% |
| Immigrants | Brazil | 99.6 /100 | #85 | Exceptional 2.2% |
| Egyptians | 99.4 /100 | #86 | Exceptional 2.2% |
| Immigrants | Zimbabwe | 99.4 /100 | #87 | Exceptional 2.2% |
| Immigrants | Nepal | 99.3 /100 | #88 | Exceptional 2.2% |
| British | 99.3 /100 | #89 | Exceptional 2.2% |
| Immigrants | Scotland | 99.2 /100 | #90 | Exceptional 2.2% |