Immigrants from Nigeria vs South American Doctorate Degree
COMPARE
Immigrants from Nigeria
South American
Doctorate Degree
Doctorate Degree Comparison
Immigrants from Nigeria
South Americans
1.8%
DOCTORATE DEGREE
22.4/ 100
METRIC RATING
201st/ 347
METRIC RANK
1.8%
DOCTORATE DEGREE
29.5/ 100
METRIC RATING
191st/ 347
METRIC RANK
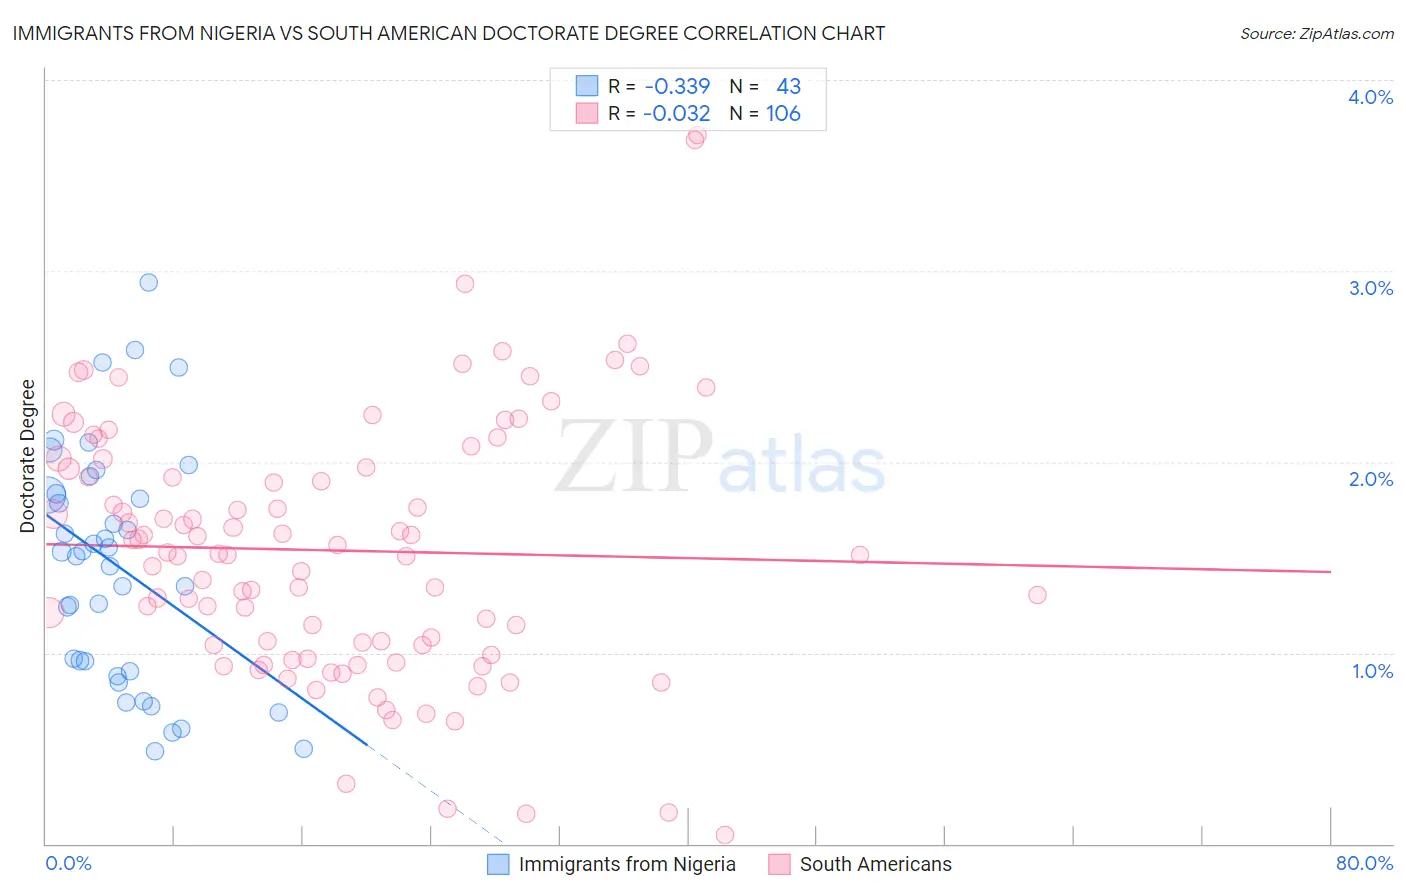
Immigrants from Nigeria vs South American Doctorate Degree Correlation Chart
The statistical analysis conducted on geographies consisting of 282,146,765 people shows a mild negative correlation between the proportion of Immigrants from Nigeria and percentage of population with at least doctorate degree education in the United States with a correlation coefficient (R) of -0.339 and weighted average of 1.8%. Similarly, the statistical analysis conducted on geographies consisting of 486,603,366 people shows no correlation between the proportion of South Americans and percentage of population with at least doctorate degree education in the United States with a correlation coefficient (R) of -0.032 and weighted average of 1.8%, a difference of 1.4%.
Doctorate Degree Correlation Summary
| Measurement | Immigrants from Nigeria | South American |
| Minimum | 0.48% | 0.049% |
| Maximum | 2.9% | 3.7% |
| Range | 2.5% | 3.7% |
| Mean | 1.5% | 1.5% |
| Median | 1.5% | 1.5% |
| Interquartile 25% (IQ1) | 0.90% | 1.0% |
| Interquartile 75% (IQ3) | 1.8% | 2.0% |
| Interquartile Range (IQR) | 0.93% | 0.93% |
| Standard Deviation (Sample) | 0.61% | 0.68% |
| Standard Deviation (Population) | 0.61% | 0.68% |
Demographics Similar to Immigrants from Nigeria and South Americans by Doctorate Degree
In terms of doctorate degree, the demographic groups most similar to Immigrants from Nigeria are White/Caucasian (1.8%, a difference of 0.070%), Immigrants from South America (1.8%, a difference of 0.18%), Portuguese (1.8%, a difference of 0.23%), Immigrants from Vietnam (1.8%, a difference of 0.25%), and Somali (1.7%, a difference of 0.28%). Similarly, the demographic groups most similar to South Americans are Immigrants from Costa Rica (1.8%, a difference of 0.12%), French Canadian (1.8%, a difference of 0.13%), German (1.8%, a difference of 0.18%), Dutch (1.8%, a difference of 0.39%), and German Russian (1.8%, a difference of 0.46%).
| Demographics | Rating | Rank | Doctorate Degree |
| Peruvians | 34.4 /100 | #186 | Fair 1.8% |
| Czechoslovakians | 33.0 /100 | #187 | Fair 1.8% |
| Germans | 30.5 /100 | #188 | Fair 1.8% |
| French Canadians | 30.2 /100 | #189 | Fair 1.8% |
| Immigrants | Costa Rica | 30.2 /100 | #190 | Fair 1.8% |
| South Americans | 29.5 /100 | #191 | Fair 1.8% |
| Dutch | 27.4 /100 | #192 | Fair 1.8% |
| German Russians | 27.1 /100 | #193 | Fair 1.8% |
| Uruguayans | 26.2 /100 | #194 | Fair 1.8% |
| Immigrants | Somalia | 25.4 /100 | #195 | Fair 1.8% |
| Sub-Saharan Africans | 25.1 /100 | #196 | Fair 1.8% |
| Chinese | 25.1 /100 | #197 | Fair 1.8% |
| Immigrants | Ghana | 24.6 /100 | #198 | Fair 1.8% |
| Immigrants | South America | 23.3 /100 | #199 | Fair 1.8% |
| Whites/Caucasians | 22.8 /100 | #200 | Fair 1.8% |
| Immigrants | Nigeria | 22.4 /100 | #201 | Fair 1.8% |
| Portuguese | 21.4 /100 | #202 | Fair 1.8% |
| Immigrants | Vietnam | 21.4 /100 | #203 | Fair 1.8% |
| Somalis | 21.2 /100 | #204 | Fair 1.7% |
| Venezuelans | 19.5 /100 | #205 | Poor 1.7% |
| Immigrants | Peru | 17.6 /100 | #206 | Poor 1.7% |