Immigrants from Nigeria vs Pakistani Doctorate Degree
COMPARE
Immigrants from Nigeria
Pakistani
Doctorate Degree
Doctorate Degree Comparison
Immigrants from Nigeria
Pakistanis
1.8%
DOCTORATE DEGREE
22.4/ 100
METRIC RATING
201st/ 347
METRIC RANK
2.0%
DOCTORATE DEGREE
95.8/ 100
METRIC RATING
119th/ 347
METRIC RANK
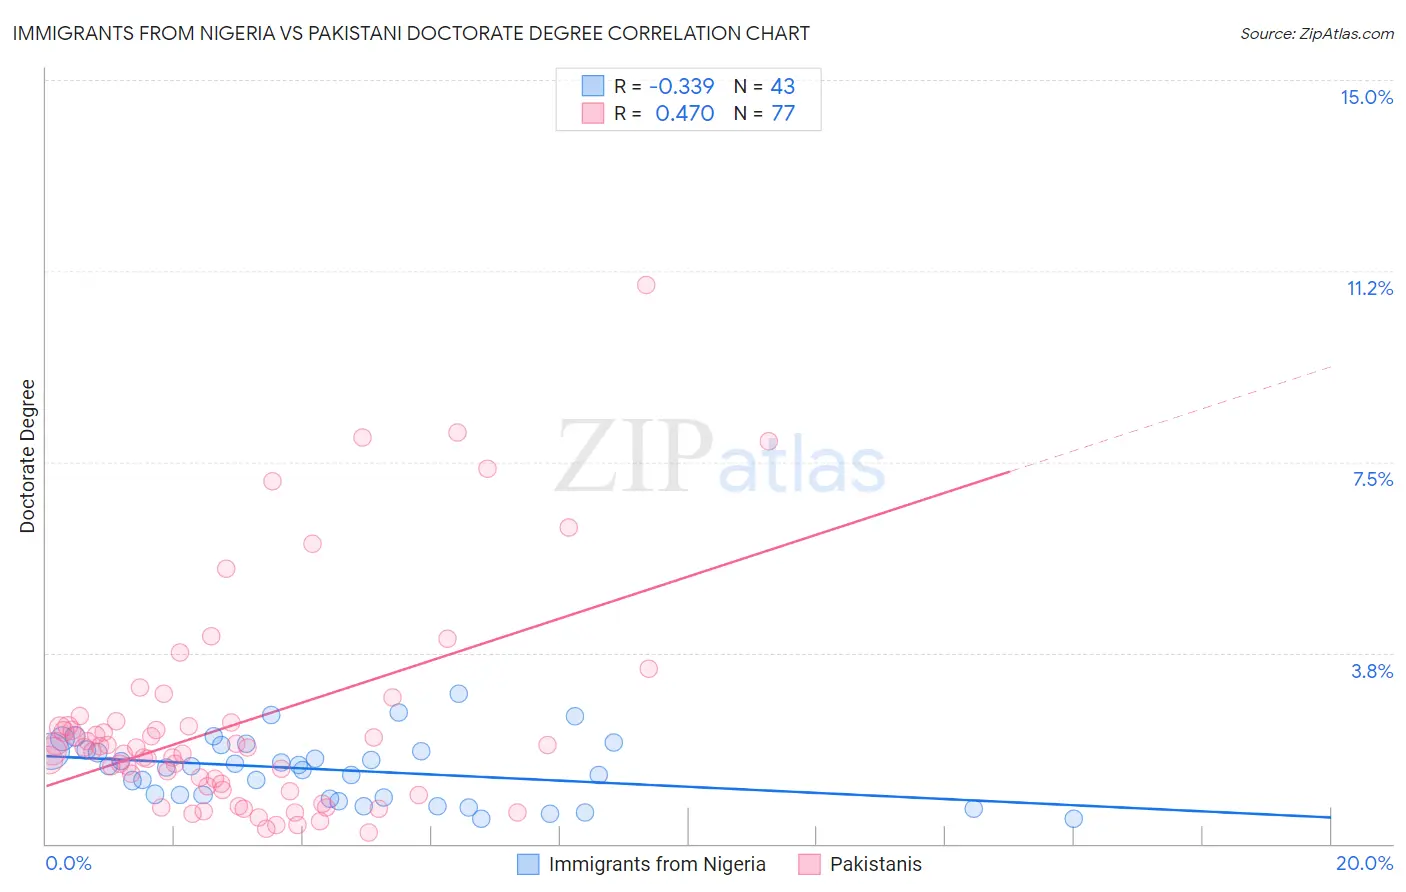
Immigrants from Nigeria vs Pakistani Doctorate Degree Correlation Chart
The statistical analysis conducted on geographies consisting of 282,146,765 people shows a mild negative correlation between the proportion of Immigrants from Nigeria and percentage of population with at least doctorate degree education in the United States with a correlation coefficient (R) of -0.339 and weighted average of 1.8%. Similarly, the statistical analysis conducted on geographies consisting of 333,015,067 people shows a moderate positive correlation between the proportion of Pakistanis and percentage of population with at least doctorate degree education in the United States with a correlation coefficient (R) of 0.470 and weighted average of 2.0%, a difference of 16.8%.
Doctorate Degree Correlation Summary
| Measurement | Immigrants from Nigeria | Pakistani |
| Minimum | 0.48% | 0.22% |
| Maximum | 2.9% | 11.0% |
| Range | 2.5% | 10.8% |
| Mean | 1.5% | 2.4% |
| Median | 1.5% | 1.9% |
| Interquartile 25% (IQ1) | 0.90% | 1.1% |
| Interquartile 75% (IQ3) | 1.8% | 2.4% |
| Interquartile Range (IQR) | 0.93% | 1.3% |
| Standard Deviation (Sample) | 0.61% | 2.1% |
| Standard Deviation (Population) | 0.61% | 2.1% |
Similar Demographics by Doctorate Degree
Demographics Similar to Immigrants from Nigeria by Doctorate Degree
In terms of doctorate degree, the demographic groups most similar to Immigrants from Nigeria are White/Caucasian (1.8%, a difference of 0.070%), Immigrants from South America (1.8%, a difference of 0.18%), Portuguese (1.8%, a difference of 0.23%), Immigrants from Vietnam (1.8%, a difference of 0.25%), and Somali (1.7%, a difference of 0.28%).
| Demographics | Rating | Rank | Doctorate Degree |
| Uruguayans | 26.2 /100 | #194 | Fair 1.8% |
| Immigrants | Somalia | 25.4 /100 | #195 | Fair 1.8% |
| Sub-Saharan Africans | 25.1 /100 | #196 | Fair 1.8% |
| Chinese | 25.1 /100 | #197 | Fair 1.8% |
| Immigrants | Ghana | 24.6 /100 | #198 | Fair 1.8% |
| Immigrants | South America | 23.3 /100 | #199 | Fair 1.8% |
| Whites/Caucasians | 22.8 /100 | #200 | Fair 1.8% |
| Immigrants | Nigeria | 22.4 /100 | #201 | Fair 1.8% |
| Portuguese | 21.4 /100 | #202 | Fair 1.8% |
| Immigrants | Vietnam | 21.4 /100 | #203 | Fair 1.8% |
| Somalis | 21.2 /100 | #204 | Fair 1.7% |
| Venezuelans | 19.5 /100 | #205 | Poor 1.7% |
| Immigrants | Peru | 17.6 /100 | #206 | Poor 1.7% |
| Yugoslavians | 17.1 /100 | #207 | Poor 1.7% |
| Colombians | 16.1 /100 | #208 | Poor 1.7% |
Demographics Similar to Pakistanis by Doctorate Degree
In terms of doctorate degree, the demographic groups most similar to Pakistanis are Icelander (2.1%, a difference of 0.13%), Lebanese (2.1%, a difference of 0.17%), Immigrants from Morocco (2.0%, a difference of 0.28%), Maltese (2.1%, a difference of 0.34%), and Immigrants from Jordan (2.0%, a difference of 0.76%).
| Demographics | Rating | Rank | Doctorate Degree |
| Syrians | 97.1 /100 | #112 | Exceptional 2.1% |
| Immigrants | Italy | 96.9 /100 | #113 | Exceptional 2.1% |
| Immigrants | Croatia | 96.8 /100 | #114 | Exceptional 2.1% |
| Taiwanese | 96.7 /100 | #115 | Exceptional 2.1% |
| Maltese | 96.2 /100 | #116 | Exceptional 2.1% |
| Lebanese | 96.0 /100 | #117 | Exceptional 2.1% |
| Icelanders | 96.0 /100 | #118 | Exceptional 2.1% |
| Pakistanis | 95.8 /100 | #119 | Exceptional 2.0% |
| Immigrants | Morocco | 95.5 /100 | #120 | Exceptional 2.0% |
| Immigrants | Jordan | 94.8 /100 | #121 | Exceptional 2.0% |
| Immigrants | Southern Europe | 94.7 /100 | #122 | Exceptional 2.0% |
| Croatians | 94.0 /100 | #123 | Exceptional 2.0% |
| Ute | 93.2 /100 | #124 | Exceptional 2.0% |
| Moroccans | 93.0 /100 | #125 | Exceptional 2.0% |
| Jordanians | 92.1 /100 | #126 | Exceptional 2.0% |