Immigrants from Nicaragua vs Immigrants from Trinidad and Tobago GED/Equivalency
COMPARE
Immigrants from Nicaragua
Immigrants from Trinidad and Tobago
GED/Equivalency
GED/Equivalency Comparison
Immigrants from Nicaragua
Immigrants from Trinidad and Tobago
79.9%
GED/EQUIVALENCY
0.0/ 100
METRIC RATING
323rd/ 347
METRIC RANK
82.8%
GED/EQUIVALENCY
0.1/ 100
METRIC RATING
274th/ 347
METRIC RANK
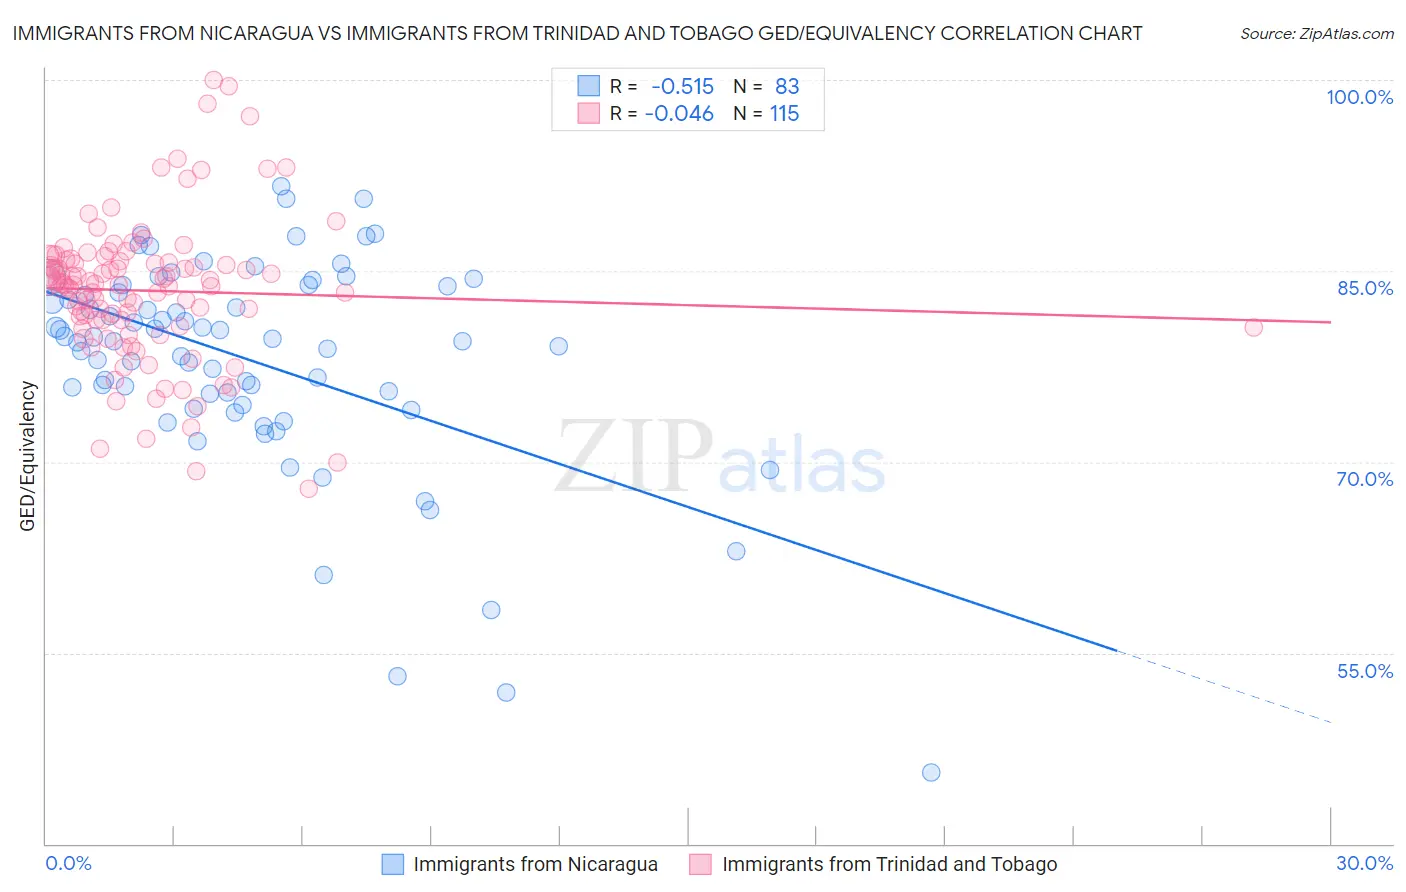
Immigrants from Nicaragua vs Immigrants from Trinidad and Tobago GED/Equivalency Correlation Chart
The statistical analysis conducted on geographies consisting of 236,340,156 people shows a substantial negative correlation between the proportion of Immigrants from Nicaragua and percentage of population with at least ged/equivalency education in the United States with a correlation coefficient (R) of -0.515 and weighted average of 79.9%. Similarly, the statistical analysis conducted on geographies consisting of 223,527,464 people shows no correlation between the proportion of Immigrants from Trinidad and Tobago and percentage of population with at least ged/equivalency education in the United States with a correlation coefficient (R) of -0.046 and weighted average of 82.8%, a difference of 3.7%.
GED/Equivalency Correlation Summary
| Measurement | Immigrants from Nicaragua | Immigrants from Trinidad and Tobago |
| Minimum | 45.6% | 67.9% |
| Maximum | 91.7% | 100.0% |
| Range | 46.1% | 32.1% |
| Mean | 77.9% | 83.4% |
| Median | 79.5% | 83.9% |
| Interquartile 25% (IQ1) | 74.4% | 80.6% |
| Interquartile 75% (IQ3) | 83.8% | 85.8% |
| Interquartile Range (IQR) | 9.3% | 5.2% |
| Standard Deviation (Sample) | 8.4% | 5.7% |
| Standard Deviation (Population) | 8.4% | 5.7% |
Similar Demographics by GED/Equivalency
Demographics Similar to Immigrants from Nicaragua by GED/Equivalency
In terms of ged/equivalency, the demographic groups most similar to Immigrants from Nicaragua are Lumbee (80.0%, a difference of 0.12%), Yup'ik (80.0%, a difference of 0.19%), Immigrants from Cuba (80.2%, a difference of 0.36%), Mexican American Indian (79.4%, a difference of 0.65%), and Honduran (79.3%, a difference of 0.76%).
| Demographics | Rating | Rank | GED/Equivalency |
| Central American Indians | 0.0 /100 | #316 | Tragic 80.6% |
| Immigrants | Caribbean | 0.0 /100 | #317 | Tragic 80.5% |
| Yaqui | 0.0 /100 | #318 | Tragic 80.5% |
| Immigrants | Belize | 0.0 /100 | #319 | Tragic 80.5% |
| Immigrants | Cuba | 0.0 /100 | #320 | Tragic 80.2% |
| Yup'ik | 0.0 /100 | #321 | Tragic 80.0% |
| Lumbee | 0.0 /100 | #322 | Tragic 80.0% |
| Immigrants | Nicaragua | 0.0 /100 | #323 | Tragic 79.9% |
| Mexican American Indians | 0.0 /100 | #324 | Tragic 79.4% |
| Hondurans | 0.0 /100 | #325 | Tragic 79.3% |
| Yuman | 0.0 /100 | #326 | Tragic 79.2% |
| Central Americans | 0.0 /100 | #327 | Tragic 79.2% |
| Hispanics or Latinos | 0.0 /100 | #328 | Tragic 79.1% |
| Dominicans | 0.0 /100 | #329 | Tragic 79.1% |
| Immigrants | Cabo Verde | 0.0 /100 | #330 | Tragic 78.9% |
Demographics Similar to Immigrants from Trinidad and Tobago by GED/Equivalency
In terms of ged/equivalency, the demographic groups most similar to Immigrants from Trinidad and Tobago are Barbadian (82.9%, a difference of 0.020%), Pennsylvania German (82.9%, a difference of 0.020%), Seminole (82.8%, a difference of 0.060%), U.S. Virgin Islander (82.9%, a difference of 0.070%), and Black/African American (82.8%, a difference of 0.080%).
| Demographics | Rating | Rank | GED/Equivalency |
| Trinidadians and Tobagonians | 0.2 /100 | #267 | Tragic 83.0% |
| Immigrants | Burma/Myanmar | 0.2 /100 | #268 | Tragic 83.0% |
| Hopi | 0.2 /100 | #269 | Tragic 83.0% |
| Immigrants | Jamaica | 0.2 /100 | #270 | Tragic 82.9% |
| U.S. Virgin Islanders | 0.2 /100 | #271 | Tragic 82.9% |
| Barbadians | 0.1 /100 | #272 | Tragic 82.9% |
| Pennsylvania Germans | 0.1 /100 | #273 | Tragic 82.9% |
| Immigrants | Trinidad and Tobago | 0.1 /100 | #274 | Tragic 82.8% |
| Seminole | 0.1 /100 | #275 | Tragic 82.8% |
| Blacks/African Americans | 0.1 /100 | #276 | Tragic 82.8% |
| Arapaho | 0.1 /100 | #277 | Tragic 82.8% |
| Immigrants | Laos | 0.1 /100 | #278 | Tragic 82.7% |
| Immigrants | Fiji | 0.1 /100 | #279 | Tragic 82.7% |
| Cheyenne | 0.1 /100 | #280 | Tragic 82.7% |
| Sioux | 0.1 /100 | #281 | Tragic 82.6% |