Immigrants from Netherlands vs Immigrants from Ecuador College, 1 year or more
COMPARE
Immigrants from Netherlands
Immigrants from Ecuador
College, 1 year or more
College, 1 year or more Comparison
Immigrants from Netherlands
Immigrants from Ecuador
64.2%
COLLEGE, 1 YEAR OR MORE
99.8/ 100
METRIC RATING
52nd/ 347
METRIC RANK
53.4%
COLLEGE, 1 YEAR OR MORE
0.0/ 100
METRIC RATING
289th/ 347
METRIC RANK
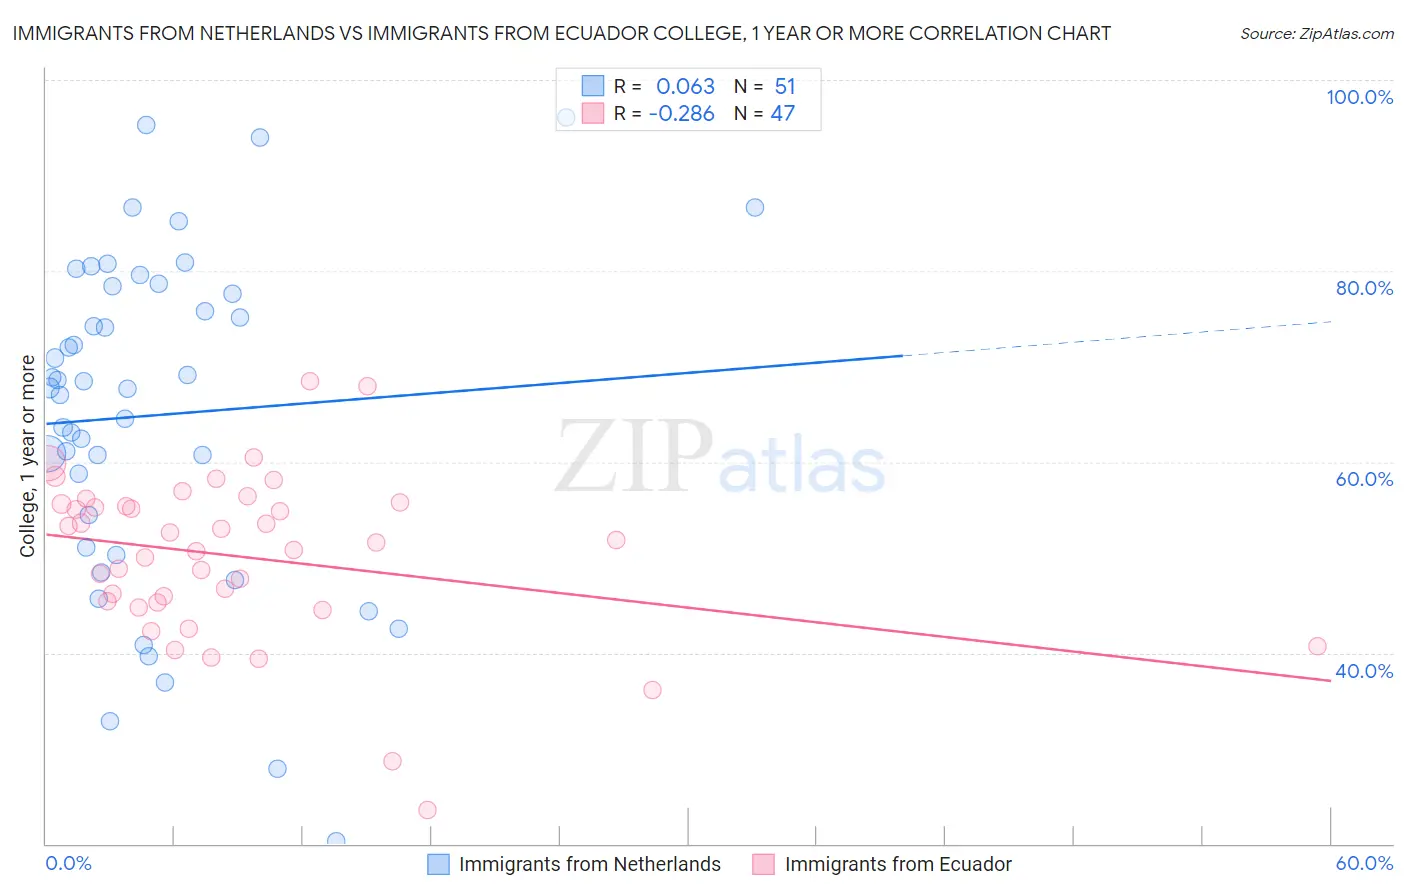
Immigrants from Netherlands vs Immigrants from Ecuador College, 1 year or more Correlation Chart
The statistical analysis conducted on geographies consisting of 237,877,405 people shows a slight positive correlation between the proportion of Immigrants from Netherlands and percentage of population with at least college, 1 year or more education in the United States with a correlation coefficient (R) of 0.063 and weighted average of 64.2%. Similarly, the statistical analysis conducted on geographies consisting of 271,020,679 people shows a weak negative correlation between the proportion of Immigrants from Ecuador and percentage of population with at least college, 1 year or more education in the United States with a correlation coefficient (R) of -0.286 and weighted average of 53.4%, a difference of 20.2%.
College, 1 year or more Correlation Summary
| Measurement | Immigrants from Netherlands | Immigrants from Ecuador |
| Minimum | 20.3% | 23.5% |
| Maximum | 96.1% | 68.5% |
| Range | 75.8% | 44.9% |
| Mean | 64.9% | 50.1% |
| Median | 67.8% | 51.6% |
| Interquartile 25% (IQ1) | 51.0% | 45.2% |
| Interquartile 75% (IQ3) | 78.5% | 55.6% |
| Interquartile Range (IQR) | 27.5% | 10.4% |
| Standard Deviation (Sample) | 17.5% | 8.7% |
| Standard Deviation (Population) | 17.3% | 8.6% |
Similar Demographics by College, 1 year or more
Demographics Similar to Immigrants from Netherlands by College, 1 year or more
In terms of college, 1 year or more, the demographic groups most similar to Immigrants from Netherlands are Asian (64.2%, a difference of 0.020%), Zimbabwean (64.2%, a difference of 0.050%), Immigrants from Malaysia (64.3%, a difference of 0.16%), Immigrants from Belarus (64.1%, a difference of 0.17%), and Immigrants from Czechoslovakia (64.1%, a difference of 0.20%).
| Demographics | Rating | Rank | College, 1 year or more |
| Immigrants | Lithuania | 99.9 /100 | #45 | Exceptional 64.6% |
| Bhutanese | 99.9 /100 | #46 | Exceptional 64.6% |
| Australians | 99.9 /100 | #47 | Exceptional 64.6% |
| Immigrants | Bulgaria | 99.9 /100 | #48 | Exceptional 64.6% |
| New Zealanders | 99.9 /100 | #49 | Exceptional 64.6% |
| Immigrants | Austria | 99.8 /100 | #50 | Exceptional 64.4% |
| Immigrants | Malaysia | 99.8 /100 | #51 | Exceptional 64.3% |
| Immigrants | Netherlands | 99.8 /100 | #52 | Exceptional 64.2% |
| Asians | 99.8 /100 | #53 | Exceptional 64.2% |
| Zimbabweans | 99.8 /100 | #54 | Exceptional 64.2% |
| Immigrants | Belarus | 99.7 /100 | #55 | Exceptional 64.1% |
| Immigrants | Czechoslovakia | 99.7 /100 | #56 | Exceptional 64.1% |
| South Africans | 99.7 /100 | #57 | Exceptional 64.1% |
| Immigrants | Asia | 99.7 /100 | #58 | Exceptional 64.0% |
| Immigrants | Serbia | 99.6 /100 | #59 | Exceptional 63.8% |
Demographics Similar to Immigrants from Ecuador by College, 1 year or more
In terms of college, 1 year or more, the demographic groups most similar to Immigrants from Ecuador are Alaska Native (53.4%, a difference of 0.0%), Alaskan Athabascan (53.4%, a difference of 0.020%), Cuban (53.4%, a difference of 0.070%), Immigrants from Belize (53.5%, a difference of 0.17%), and Chickasaw (53.3%, a difference of 0.20%).
| Demographics | Rating | Rank | College, 1 year or more |
| Guyanese | 0.1 /100 | #282 | Tragic 54.1% |
| Nicaraguans | 0.1 /100 | #283 | Tragic 53.9% |
| Ute | 0.1 /100 | #284 | Tragic 53.8% |
| Immigrants | Guyana | 0.1 /100 | #285 | Tragic 53.5% |
| Central American Indians | 0.1 /100 | #286 | Tragic 53.5% |
| Immigrants | Belize | 0.1 /100 | #287 | Tragic 53.5% |
| Alaska Natives | 0.0 /100 | #288 | Tragic 53.4% |
| Immigrants | Ecuador | 0.0 /100 | #289 | Tragic 53.4% |
| Alaskan Athabascans | 0.0 /100 | #290 | Tragic 53.4% |
| Cubans | 0.0 /100 | #291 | Tragic 53.4% |
| Chickasaw | 0.0 /100 | #292 | Tragic 53.3% |
| Blacks/African Americans | 0.0 /100 | #293 | Tragic 53.3% |
| Cherokee | 0.0 /100 | #294 | Tragic 53.2% |
| Yaqui | 0.0 /100 | #295 | Tragic 53.2% |
| Sioux | 0.0 /100 | #296 | Tragic 53.0% |