Immigrants from Netherlands vs Pennsylvania German College, 1 year or more
COMPARE
Immigrants from Netherlands
Pennsylvania German
College, 1 year or more
College, 1 year or more Comparison
Immigrants from Netherlands
Pennsylvania Germans
64.2%
COLLEGE, 1 YEAR OR MORE
99.8/ 100
METRIC RATING
52nd/ 347
METRIC RANK
48.5%
COLLEGE, 1 YEAR OR MORE
0.0/ 100
METRIC RATING
337th/ 347
METRIC RANK
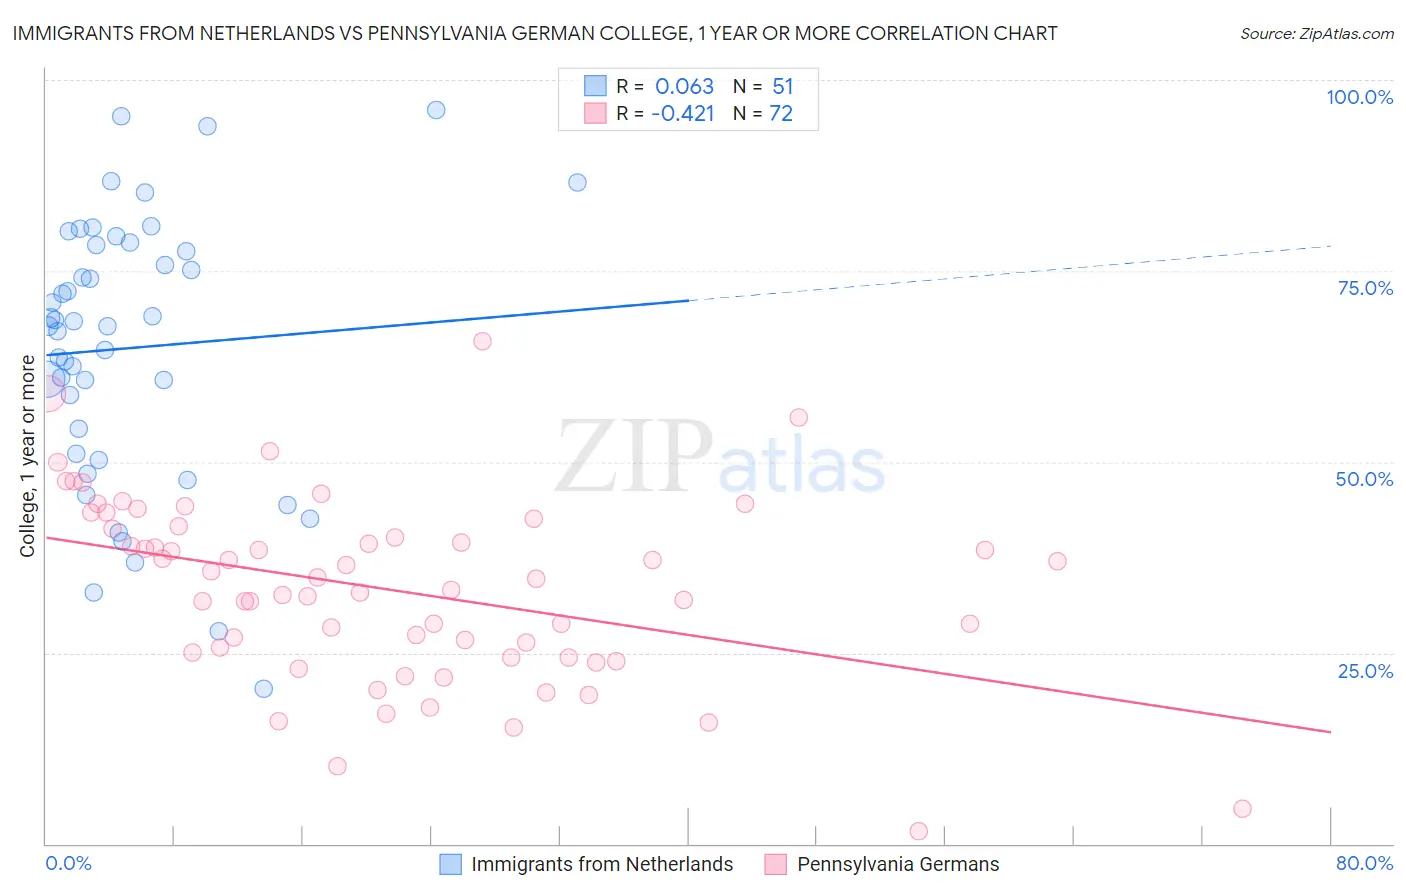
Immigrants from Netherlands vs Pennsylvania German College, 1 year or more Correlation Chart
The statistical analysis conducted on geographies consisting of 237,877,405 people shows a slight positive correlation between the proportion of Immigrants from Netherlands and percentage of population with at least college, 1 year or more education in the United States with a correlation coefficient (R) of 0.063 and weighted average of 64.2%. Similarly, the statistical analysis conducted on geographies consisting of 234,102,538 people shows a moderate negative correlation between the proportion of Pennsylvania Germans and percentage of population with at least college, 1 year or more education in the United States with a correlation coefficient (R) of -0.421 and weighted average of 48.5%, a difference of 32.4%.
College, 1 year or more Correlation Summary
| Measurement | Immigrants from Netherlands | Pennsylvania German |
| Minimum | 20.3% | 1.6% |
| Maximum | 96.1% | 65.7% |
| Range | 75.8% | 64.2% |
| Mean | 64.9% | 33.3% |
| Median | 67.8% | 34.0% |
| Interquartile 25% (IQ1) | 51.0% | 24.7% |
| Interquartile 75% (IQ3) | 78.5% | 41.4% |
| Interquartile Range (IQR) | 27.5% | 16.7% |
| Standard Deviation (Sample) | 17.5% | 12.1% |
| Standard Deviation (Population) | 17.3% | 12.0% |
Similar Demographics by College, 1 year or more
Demographics Similar to Immigrants from Netherlands by College, 1 year or more
In terms of college, 1 year or more, the demographic groups most similar to Immigrants from Netherlands are Asian (64.2%, a difference of 0.020%), Zimbabwean (64.2%, a difference of 0.050%), Immigrants from Malaysia (64.3%, a difference of 0.16%), Immigrants from Belarus (64.1%, a difference of 0.17%), and Immigrants from Czechoslovakia (64.1%, a difference of 0.20%).
| Demographics | Rating | Rank | College, 1 year or more |
| Immigrants | Lithuania | 99.9 /100 | #45 | Exceptional 64.6% |
| Bhutanese | 99.9 /100 | #46 | Exceptional 64.6% |
| Australians | 99.9 /100 | #47 | Exceptional 64.6% |
| Immigrants | Bulgaria | 99.9 /100 | #48 | Exceptional 64.6% |
| New Zealanders | 99.9 /100 | #49 | Exceptional 64.6% |
| Immigrants | Austria | 99.8 /100 | #50 | Exceptional 64.4% |
| Immigrants | Malaysia | 99.8 /100 | #51 | Exceptional 64.3% |
| Immigrants | Netherlands | 99.8 /100 | #52 | Exceptional 64.2% |
| Asians | 99.8 /100 | #53 | Exceptional 64.2% |
| Zimbabweans | 99.8 /100 | #54 | Exceptional 64.2% |
| Immigrants | Belarus | 99.7 /100 | #55 | Exceptional 64.1% |
| Immigrants | Czechoslovakia | 99.7 /100 | #56 | Exceptional 64.1% |
| South Africans | 99.7 /100 | #57 | Exceptional 64.1% |
| Immigrants | Asia | 99.7 /100 | #58 | Exceptional 64.0% |
| Immigrants | Serbia | 99.6 /100 | #59 | Exceptional 63.8% |
Demographics Similar to Pennsylvania Germans by College, 1 year or more
In terms of college, 1 year or more, the demographic groups most similar to Pennsylvania Germans are Spanish American Indian (48.5%, a difference of 0.010%), Immigrants from Central America (48.5%, a difference of 0.050%), Immigrants from the Azores (48.4%, a difference of 0.31%), Yuman (48.7%, a difference of 0.45%), and Lumbee (48.9%, a difference of 0.73%).
| Demographics | Rating | Rank | College, 1 year or more |
| Natives/Alaskans | 0.0 /100 | #330 | Tragic 50.2% |
| Immigrants | Yemen | 0.0 /100 | #331 | Tragic 50.0% |
| Mexicans | 0.0 /100 | #332 | Tragic 49.2% |
| Immigrants | Dominican Republic | 0.0 /100 | #333 | Tragic 49.1% |
| Lumbee | 0.0 /100 | #334 | Tragic 48.9% |
| Yuman | 0.0 /100 | #335 | Tragic 48.7% |
| Spanish American Indians | 0.0 /100 | #336 | Tragic 48.5% |
| Pennsylvania Germans | 0.0 /100 | #337 | Tragic 48.5% |
| Immigrants | Central America | 0.0 /100 | #338 | Tragic 48.5% |
| Immigrants | Azores | 0.0 /100 | #339 | Tragic 48.4% |
| Immigrants | Cabo Verde | 0.0 /100 | #340 | Tragic 48.1% |
| Immigrants | Mexico | 0.0 /100 | #341 | Tragic 47.5% |
| Inupiat | 0.0 /100 | #342 | Tragic 47.2% |
| Tohono O'odham | 0.0 /100 | #343 | Tragic 47.1% |
| Yakama | 0.0 /100 | #344 | Tragic 46.2% |