Immigrants from Nepal vs Japanese 11th Grade
COMPARE
Immigrants from Nepal
Japanese
11th Grade
11th Grade Comparison
Immigrants from Nepal
Japanese
92.4%
11TH GRADE
36.4/ 100
METRIC RATING
185th/ 347
METRIC RANK
89.9%
11TH GRADE
0.0/ 100
METRIC RATING
299th/ 347
METRIC RANK
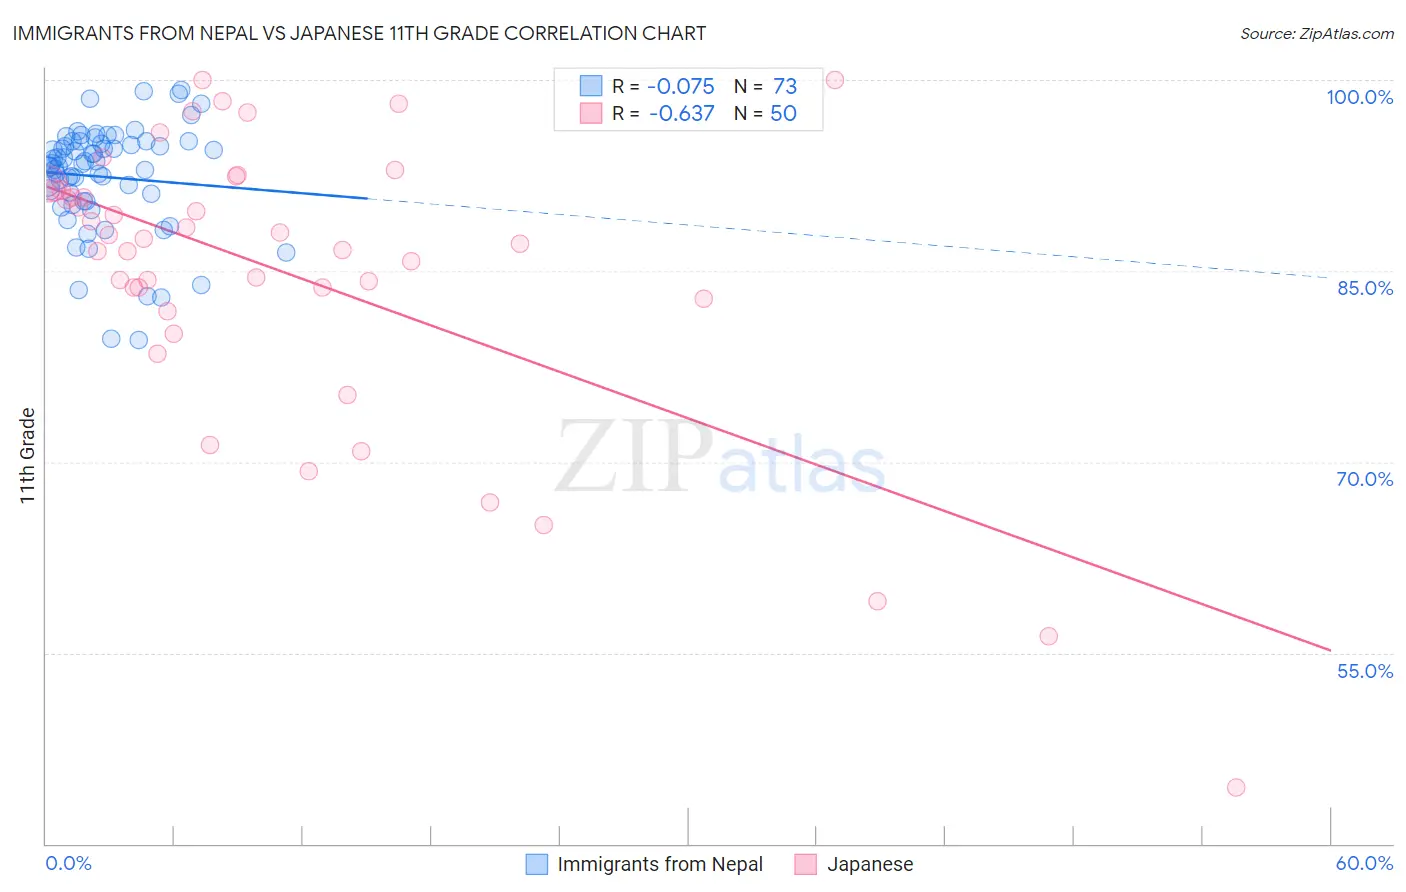
Immigrants from Nepal vs Japanese 11th Grade Correlation Chart
The statistical analysis conducted on geographies consisting of 186,780,807 people shows a slight negative correlation between the proportion of Immigrants from Nepal and percentage of population with at least 11th grade education in the United States with a correlation coefficient (R) of -0.075 and weighted average of 92.4%. Similarly, the statistical analysis conducted on geographies consisting of 249,183,224 people shows a significant negative correlation between the proportion of Japanese and percentage of population with at least 11th grade education in the United States with a correlation coefficient (R) of -0.637 and weighted average of 89.9%, a difference of 2.8%.
11th Grade Correlation Summary
| Measurement | Immigrants from Nepal | Japanese |
| Minimum | 79.6% | 44.4% |
| Maximum | 99.2% | 100.0% |
| Range | 19.6% | 55.6% |
| Mean | 92.4% | 84.8% |
| Median | 93.4% | 87.3% |
| Interquartile 25% (IQ1) | 90.5% | 82.8% |
| Interquartile 75% (IQ3) | 95.1% | 91.4% |
| Interquartile Range (IQR) | 4.6% | 8.6% |
| Standard Deviation (Sample) | 4.2% | 11.5% |
| Standard Deviation (Population) | 4.2% | 11.4% |
Similar Demographics by 11th Grade
Demographics Similar to Immigrants from Nepal by 11th Grade
In terms of 11th grade, the demographic groups most similar to Immigrants from Nepal are Immigrants from Malaysia (92.4%, a difference of 0.010%), Immigrants from Asia (92.4%, a difference of 0.010%), Arapaho (92.4%, a difference of 0.010%), Immigrants from Morocco (92.4%, a difference of 0.020%), and Immigrants from Western Asia (92.4%, a difference of 0.020%).
| Demographics | Rating | Rank | 11th Grade |
| Sudanese | 43.4 /100 | #178 | Average 92.5% |
| Creek | 40.9 /100 | #179 | Average 92.4% |
| Inupiat | 40.7 /100 | #180 | Average 92.4% |
| Cherokee | 40.7 /100 | #181 | Average 92.4% |
| Immigrants | Morocco | 38.6 /100 | #182 | Fair 92.4% |
| Immigrants | Malaysia | 37.6 /100 | #183 | Fair 92.4% |
| Immigrants | Asia | 37.4 /100 | #184 | Fair 92.4% |
| Immigrants | Nepal | 36.4 /100 | #185 | Fair 92.4% |
| Arapaho | 35.1 /100 | #186 | Fair 92.4% |
| Immigrants | Western Asia | 35.0 /100 | #187 | Fair 92.4% |
| Immigrants | Indonesia | 33.7 /100 | #188 | Fair 92.4% |
| Immigrants | Chile | 33.3 /100 | #189 | Fair 92.4% |
| Chickasaw | 31.4 /100 | #190 | Fair 92.3% |
| French American Indians | 30.8 /100 | #191 | Fair 92.3% |
| Immigrants | Syria | 30.4 /100 | #192 | Fair 92.3% |
Demographics Similar to Japanese by 11th Grade
In terms of 11th grade, the demographic groups most similar to Japanese are Immigrants from Haiti (89.9%, a difference of 0.010%), Guyanese (89.9%, a difference of 0.020%), Immigrants from Fiji (89.9%, a difference of 0.030%), Navajo (90.0%, a difference of 0.10%), and Fijian (90.0%, a difference of 0.14%).
| Demographics | Rating | Rank | 11th Grade |
| Cubans | 0.0 /100 | #292 | Tragic 90.2% |
| Natives/Alaskans | 0.0 /100 | #293 | Tragic 90.2% |
| Immigrants | Grenada | 0.0 /100 | #294 | Tragic 90.1% |
| Immigrants | Vietnam | 0.0 /100 | #295 | Tragic 90.0% |
| Fijians | 0.0 /100 | #296 | Tragic 90.0% |
| Navajo | 0.0 /100 | #297 | Tragic 90.0% |
| Immigrants | Fiji | 0.0 /100 | #298 | Tragic 89.9% |
| Japanese | 0.0 /100 | #299 | Tragic 89.9% |
| Immigrants | Haiti | 0.0 /100 | #300 | Tragic 89.9% |
| Guyanese | 0.0 /100 | #301 | Tragic 89.9% |
| Immigrants | Guyana | 0.0 /100 | #302 | Tragic 89.7% |
| Immigrants | Immigrants | 0.0 /100 | #303 | Tragic 89.7% |
| Yuman | 0.0 /100 | #304 | Tragic 89.7% |
| Immigrants | Cambodia | 0.0 /100 | #305 | Tragic 89.6% |
| Ecuadorians | 0.0 /100 | #306 | Tragic 89.6% |