Immigrants from Nepal vs Swiss 11th Grade
COMPARE
Immigrants from Nepal
Swiss
11th Grade
11th Grade Comparison
Immigrants from Nepal
Swiss
92.4%
11TH GRADE
36.4/ 100
METRIC RATING
185th/ 347
METRIC RANK
93.6%
11TH GRADE
99.0/ 100
METRIC RATING
94th/ 347
METRIC RANK
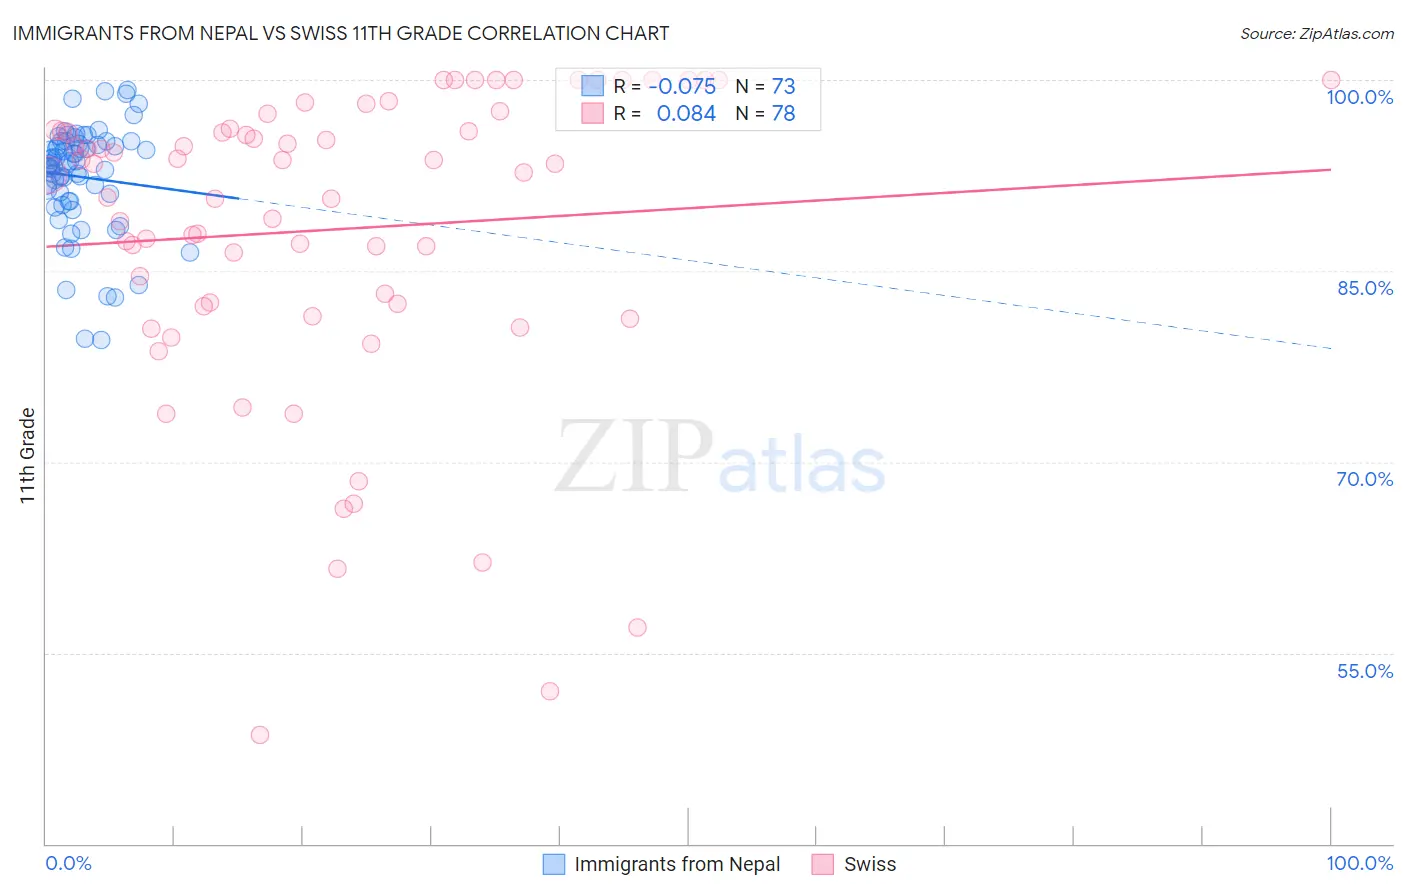
Immigrants from Nepal vs Swiss 11th Grade Correlation Chart
The statistical analysis conducted on geographies consisting of 186,780,807 people shows a slight negative correlation between the proportion of Immigrants from Nepal and percentage of population with at least 11th grade education in the United States with a correlation coefficient (R) of -0.075 and weighted average of 92.4%. Similarly, the statistical analysis conducted on geographies consisting of 465,022,572 people shows a slight positive correlation between the proportion of Swiss and percentage of population with at least 11th grade education in the United States with a correlation coefficient (R) of 0.084 and weighted average of 93.6%, a difference of 1.3%.
11th Grade Correlation Summary
| Measurement | Immigrants from Nepal | Swiss |
| Minimum | 79.6% | 48.5% |
| Maximum | 99.2% | 100.0% |
| Range | 19.6% | 51.5% |
| Mean | 92.4% | 88.2% |
| Median | 93.4% | 93.0% |
| Interquartile 25% (IQ1) | 90.5% | 82.4% |
| Interquartile 75% (IQ3) | 95.1% | 96.1% |
| Interquartile Range (IQR) | 4.6% | 13.7% |
| Standard Deviation (Sample) | 4.2% | 12.0% |
| Standard Deviation (Population) | 4.2% | 11.9% |
Similar Demographics by 11th Grade
Demographics Similar to Immigrants from Nepal by 11th Grade
In terms of 11th grade, the demographic groups most similar to Immigrants from Nepal are Immigrants from Malaysia (92.4%, a difference of 0.010%), Immigrants from Asia (92.4%, a difference of 0.010%), Arapaho (92.4%, a difference of 0.010%), Immigrants from Morocco (92.4%, a difference of 0.020%), and Immigrants from Western Asia (92.4%, a difference of 0.020%).
| Demographics | Rating | Rank | 11th Grade |
| Sudanese | 43.4 /100 | #178 | Average 92.5% |
| Creek | 40.9 /100 | #179 | Average 92.4% |
| Inupiat | 40.7 /100 | #180 | Average 92.4% |
| Cherokee | 40.7 /100 | #181 | Average 92.4% |
| Immigrants | Morocco | 38.6 /100 | #182 | Fair 92.4% |
| Immigrants | Malaysia | 37.6 /100 | #183 | Fair 92.4% |
| Immigrants | Asia | 37.4 /100 | #184 | Fair 92.4% |
| Immigrants | Nepal | 36.4 /100 | #185 | Fair 92.4% |
| Arapaho | 35.1 /100 | #186 | Fair 92.4% |
| Immigrants | Western Asia | 35.0 /100 | #187 | Fair 92.4% |
| Immigrants | Indonesia | 33.7 /100 | #188 | Fair 92.4% |
| Immigrants | Chile | 33.3 /100 | #189 | Fair 92.4% |
| Chickasaw | 31.4 /100 | #190 | Fair 92.3% |
| French American Indians | 30.8 /100 | #191 | Fair 92.3% |
| Immigrants | Syria | 30.4 /100 | #192 | Fair 92.3% |
Demographics Similar to Swiss by 11th Grade
In terms of 11th grade, the demographic groups most similar to Swiss are Immigrants from France (93.6%, a difference of 0.0%), Puget Sound Salish (93.6%, a difference of 0.020%), Immigrants from Turkey (93.5%, a difference of 0.020%), Immigrants from Iran (93.5%, a difference of 0.030%), and South African (93.6%, a difference of 0.040%).
| Demographics | Rating | Rank | 11th Grade |
| Immigrants | Western Europe | 99.2 /100 | #87 | Exceptional 93.6% |
| Cambodians | 99.2 /100 | #88 | Exceptional 93.6% |
| Burmese | 99.2 /100 | #89 | Exceptional 93.6% |
| Ottawa | 99.2 /100 | #90 | Exceptional 93.6% |
| South Africans | 99.2 /100 | #91 | Exceptional 93.6% |
| Immigrants | Bulgaria | 99.1 /100 | #92 | Exceptional 93.6% |
| Puget Sound Salish | 99.1 /100 | #93 | Exceptional 93.6% |
| Swiss | 99.0 /100 | #94 | Exceptional 93.6% |
| Immigrants | France | 99.0 /100 | #95 | Exceptional 93.6% |
| Immigrants | Turkey | 98.9 /100 | #96 | Exceptional 93.5% |
| Immigrants | Iran | 98.9 /100 | #97 | Exceptional 93.5% |
| Immigrants | Israel | 98.8 /100 | #98 | Exceptional 93.5% |
| Menominee | 98.7 /100 | #99 | Exceptional 93.5% |
| Immigrants | North Macedonia | 98.7 /100 | #100 | Exceptional 93.5% |
| Immigrants | Romania | 98.7 /100 | #101 | Exceptional 93.5% |