Houma vs Blackfeet 11th Grade
COMPARE
Houma
Blackfeet
11th Grade
11th Grade Comparison
Houma
Blackfeet
87.0%
11TH GRADE
0.0/ 100
METRIC RATING
334th/ 347
METRIC RANK
92.0%
11TH GRADE
10.1/ 100
METRIC RATING
218th/ 347
METRIC RANK
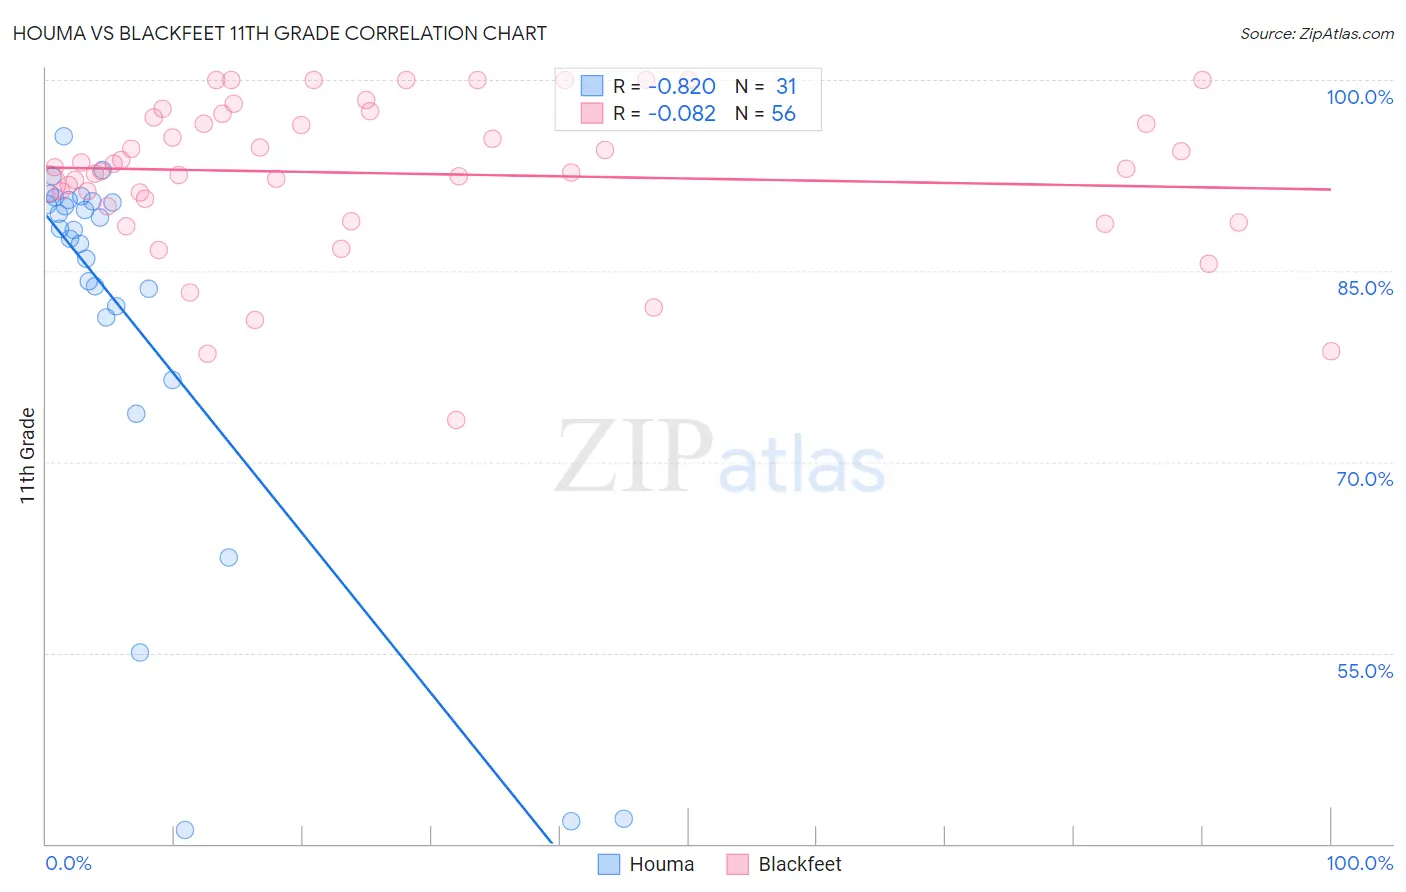
Houma vs Blackfeet 11th Grade Correlation Chart
The statistical analysis conducted on geographies consisting of 36,795,916 people shows a very strong negative correlation between the proportion of Houma and percentage of population with at least 11th grade education in the United States with a correlation coefficient (R) of -0.820 and weighted average of 87.0%. Similarly, the statistical analysis conducted on geographies consisting of 309,582,133 people shows a slight negative correlation between the proportion of Blackfeet and percentage of population with at least 11th grade education in the United States with a correlation coefficient (R) of -0.082 and weighted average of 92.0%, a difference of 5.7%.
11th Grade Correlation Summary
| Measurement | Houma | Blackfeet |
| Minimum | 41.1% | 73.3% |
| Maximum | 95.5% | 100.0% |
| Range | 54.5% | 26.7% |
| Mean | 81.2% | 92.7% |
| Median | 88.2% | 93.1% |
| Interquartile 25% (IQ1) | 81.4% | 90.4% |
| Interquartile 75% (IQ3) | 90.4% | 97.2% |
| Interquartile Range (IQR) | 9.1% | 6.8% |
| Standard Deviation (Sample) | 15.7% | 6.1% |
| Standard Deviation (Population) | 15.5% | 6.0% |
Similar Demographics by 11th Grade
Demographics Similar to Houma by 11th Grade
In terms of 11th grade, the demographic groups most similar to Houma are Immigrants from Yemen (87.1%, a difference of 0.060%), Central American (86.9%, a difference of 0.10%), Immigrants from Dominican Republic (86.9%, a difference of 0.14%), Immigrants from Honduras (86.9%, a difference of 0.14%), and Immigrants from the Azores (87.2%, a difference of 0.24%).
| Demographics | Rating | Rank | 11th Grade |
| Immigrants | Cabo Verde | 0.0 /100 | #327 | Tragic 87.6% |
| Tohono O'odham | 0.0 /100 | #328 | Tragic 87.6% |
| Mexican American Indians | 0.0 /100 | #329 | Tragic 87.5% |
| Hondurans | 0.0 /100 | #330 | Tragic 87.4% |
| Hispanics or Latinos | 0.0 /100 | #331 | Tragic 87.3% |
| Immigrants | Azores | 0.0 /100 | #332 | Tragic 87.2% |
| Immigrants | Yemen | 0.0 /100 | #333 | Tragic 87.1% |
| Houma | 0.0 /100 | #334 | Tragic 87.0% |
| Central Americans | 0.0 /100 | #335 | Tragic 86.9% |
| Immigrants | Dominican Republic | 0.0 /100 | #336 | Tragic 86.9% |
| Immigrants | Honduras | 0.0 /100 | #337 | Tragic 86.9% |
| Immigrants | Latin America | 0.0 /100 | #338 | Tragic 86.8% |
| Guatemalans | 0.0 /100 | #339 | Tragic 86.4% |
| Salvadorans | 0.0 /100 | #340 | Tragic 86.2% |
| Mexicans | 0.0 /100 | #341 | Tragic 86.1% |
Demographics Similar to Blackfeet by 11th Grade
In terms of 11th grade, the demographic groups most similar to Blackfeet are Portuguese (92.0%, a difference of 0.0%), Immigrants from Sierra Leone (92.0%, a difference of 0.030%), Somali (92.1%, a difference of 0.040%), Immigrants from Southern Europe (92.1%, a difference of 0.060%), and Afghan (92.1%, a difference of 0.070%).
| Demographics | Rating | Rank | 11th Grade |
| Immigrants | Micronesia | 17.7 /100 | #211 | Poor 92.2% |
| Koreans | 14.4 /100 | #212 | Poor 92.1% |
| Immigrants | Ethiopia | 13.9 /100 | #213 | Poor 92.1% |
| Afghans | 12.8 /100 | #214 | Poor 92.1% |
| Immigrants | Southern Europe | 12.5 /100 | #215 | Poor 92.1% |
| Somalis | 11.6 /100 | #216 | Poor 92.1% |
| Immigrants | Sierra Leone | 11.1 /100 | #217 | Poor 92.0% |
| Blackfeet | 10.1 /100 | #218 | Poor 92.0% |
| Portuguese | 10.0 /100 | #219 | Tragic 92.0% |
| South American Indians | 7.6 /100 | #220 | Tragic 92.0% |
| Immigrants | Liberia | 7.0 /100 | #221 | Tragic 91.9% |
| Immigrants | Africa | 6.5 /100 | #222 | Tragic 91.9% |
| Immigrants | Bahamas | 6.5 /100 | #223 | Tragic 91.9% |
| Costa Ricans | 6.3 /100 | #224 | Tragic 91.9% |
| Immigrants | Zaire | 5.4 /100 | #225 | Tragic 91.9% |