African vs Yugoslavian College, 1 year or more
COMPARE
African
Yugoslavian
College, 1 year or more
College, 1 year or more Comparison
Africans
Yugoslavians
55.0%
COLLEGE, 1 YEAR OR MORE
0.4/ 100
METRIC RATING
258th/ 347
METRIC RANK
59.2%
COLLEGE, 1 YEAR OR MORE
44.1/ 100
METRIC RATING
180th/ 347
METRIC RANK
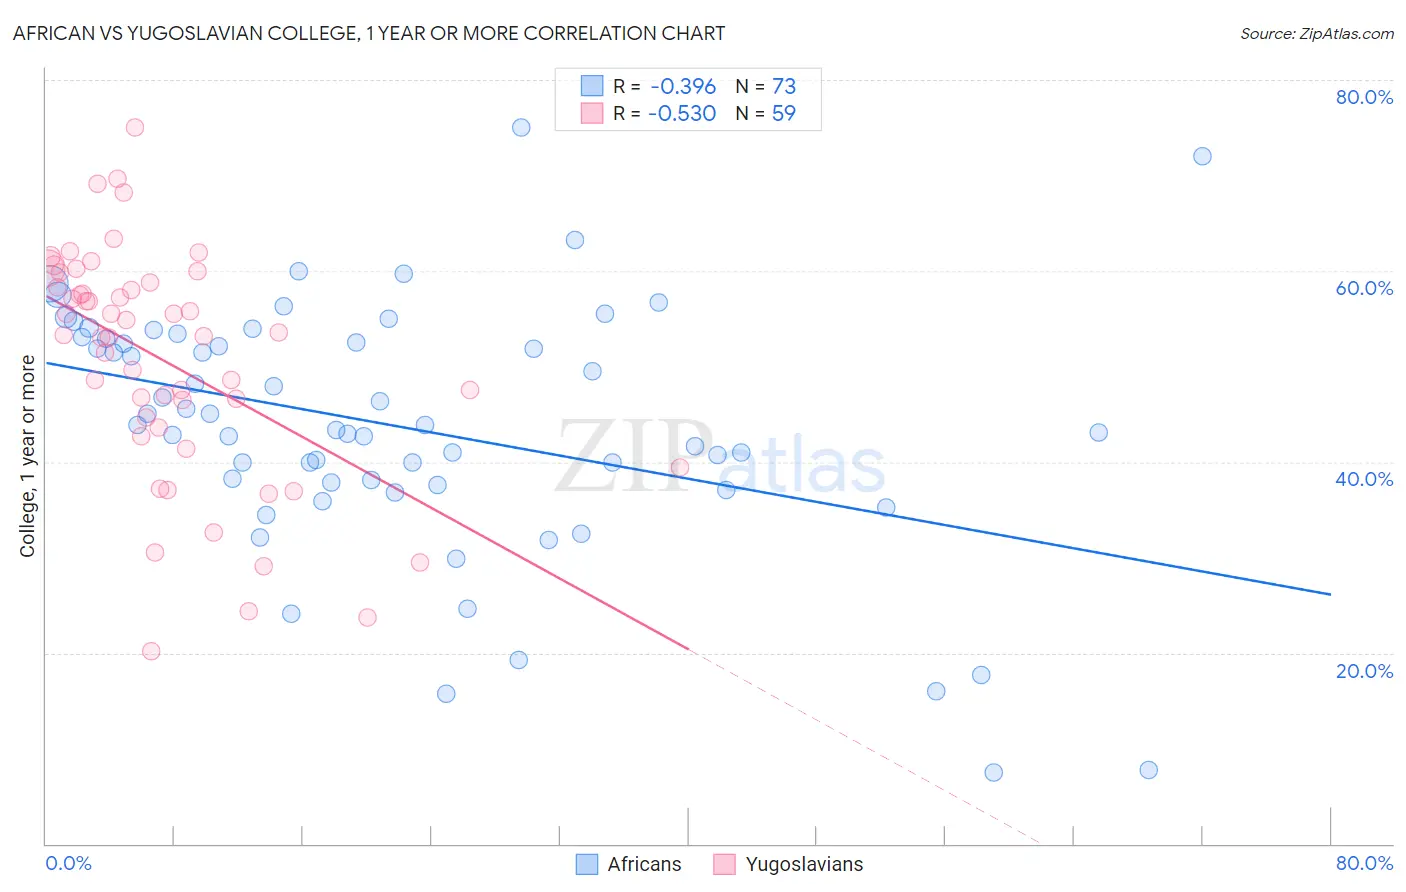
African vs Yugoslavian College, 1 year or more Correlation Chart
The statistical analysis conducted on geographies consisting of 470,090,594 people shows a mild negative correlation between the proportion of Africans and percentage of population with at least college, 1 year or more education in the United States with a correlation coefficient (R) of -0.396 and weighted average of 55.0%. Similarly, the statistical analysis conducted on geographies consisting of 285,723,201 people shows a substantial negative correlation between the proportion of Yugoslavians and percentage of population with at least college, 1 year or more education in the United States with a correlation coefficient (R) of -0.530 and weighted average of 59.2%, a difference of 7.8%.
College, 1 year or more Correlation Summary
| Measurement | African | Yugoslavian |
| Minimum | 7.4% | 20.1% |
| Maximum | 75.0% | 75.0% |
| Range | 67.6% | 54.9% |
| Mean | 43.7% | 50.6% |
| Median | 43.8% | 53.3% |
| Interquartile 25% (IQ1) | 37.7% | 43.6% |
| Interquartile 75% (IQ3) | 53.0% | 58.8% |
| Interquartile Range (IQR) | 15.3% | 15.2% |
| Standard Deviation (Sample) | 13.2% | 12.1% |
| Standard Deviation (Population) | 13.1% | 12.0% |
Similar Demographics by College, 1 year or more
Demographics Similar to Africans by College, 1 year or more
In terms of college, 1 year or more, the demographic groups most similar to Africans are Nepalese (54.9%, a difference of 0.060%), Jamaican (54.9%, a difference of 0.16%), Ottawa (54.9%, a difference of 0.19%), Immigrants from St. Vincent and the Grenadines (54.8%, a difference of 0.27%), and Indonesian (55.1%, a difference of 0.28%).
| Demographics | Rating | Rank | College, 1 year or more |
| Immigrants | Cambodia | 0.6 /100 | #251 | Tragic 55.4% |
| Aleuts | 0.6 /100 | #252 | Tragic 55.4% |
| Immigrants | Barbados | 0.6 /100 | #253 | Tragic 55.4% |
| Japanese | 0.5 /100 | #254 | Tragic 55.2% |
| Immigrants | Bahamas | 0.5 /100 | #255 | Tragic 55.2% |
| Immigrants | West Indies | 0.5 /100 | #256 | Tragic 55.2% |
| Indonesians | 0.4 /100 | #257 | Tragic 55.1% |
| Africans | 0.4 /100 | #258 | Tragic 55.0% |
| Nepalese | 0.3 /100 | #259 | Tragic 54.9% |
| Jamaicans | 0.3 /100 | #260 | Tragic 54.9% |
| Ottawa | 0.3 /100 | #261 | Tragic 54.9% |
| Immigrants | St. Vincent and the Grenadines | 0.3 /100 | #262 | Tragic 54.8% |
| U.S. Virgin Islanders | 0.3 /100 | #263 | Tragic 54.8% |
| Immigrants | Micronesia | 0.3 /100 | #264 | Tragic 54.8% |
| Immigrants | Laos | 0.2 /100 | #265 | Tragic 54.7% |
Demographics Similar to Yugoslavians by College, 1 year or more
In terms of college, 1 year or more, the demographic groups most similar to Yugoslavians are Swiss (59.2%, a difference of 0.040%), Immigrants from Bosnia and Herzegovina (59.2%, a difference of 0.070%), Bermudan (59.3%, a difference of 0.14%), Tlingit-Haida (59.4%, a difference of 0.23%), and Czechoslovakian (59.4%, a difference of 0.23%).
| Demographics | Rating | Rank | College, 1 year or more |
| Immigrants | Oceania | 51.2 /100 | #173 | Average 59.4% |
| Celtics | 50.0 /100 | #174 | Average 59.4% |
| Sri Lankans | 49.0 /100 | #175 | Average 59.4% |
| Immigrants | Poland | 48.9 /100 | #176 | Average 59.4% |
| Tlingit-Haida | 48.4 /100 | #177 | Average 59.4% |
| Czechoslovakians | 48.3 /100 | #178 | Average 59.4% |
| Bermudans | 46.6 /100 | #179 | Average 59.3% |
| Yugoslavians | 44.1 /100 | #180 | Average 59.2% |
| Swiss | 43.4 /100 | #181 | Average 59.2% |
| Immigrants | Bosnia and Herzegovina | 42.8 /100 | #182 | Average 59.2% |
| German Russians | 39.3 /100 | #183 | Fair 59.1% |
| Spaniards | 38.3 /100 | #184 | Fair 59.0% |
| South Americans | 35.9 /100 | #185 | Fair 59.0% |
| Scotch-Irish | 34.7 /100 | #186 | Fair 58.9% |
| Germans | 34.7 /100 | #187 | Fair 58.9% |