Immigrants from Russia vs Immigrants from Scotland College, Under 1 year
COMPARE
Immigrants from Russia
Immigrants from Scotland
College, Under 1 year
College, Under 1 year Comparison
Immigrants from Russia
Immigrants from Scotland
69.9%
COLLEGE, UNDER 1 YEAR
99.8/ 100
METRIC RATING
52nd/ 347
METRIC RANK
69.4%
COLLEGE, UNDER 1 YEAR
99.6/ 100
METRIC RATING
56th/ 347
METRIC RANK
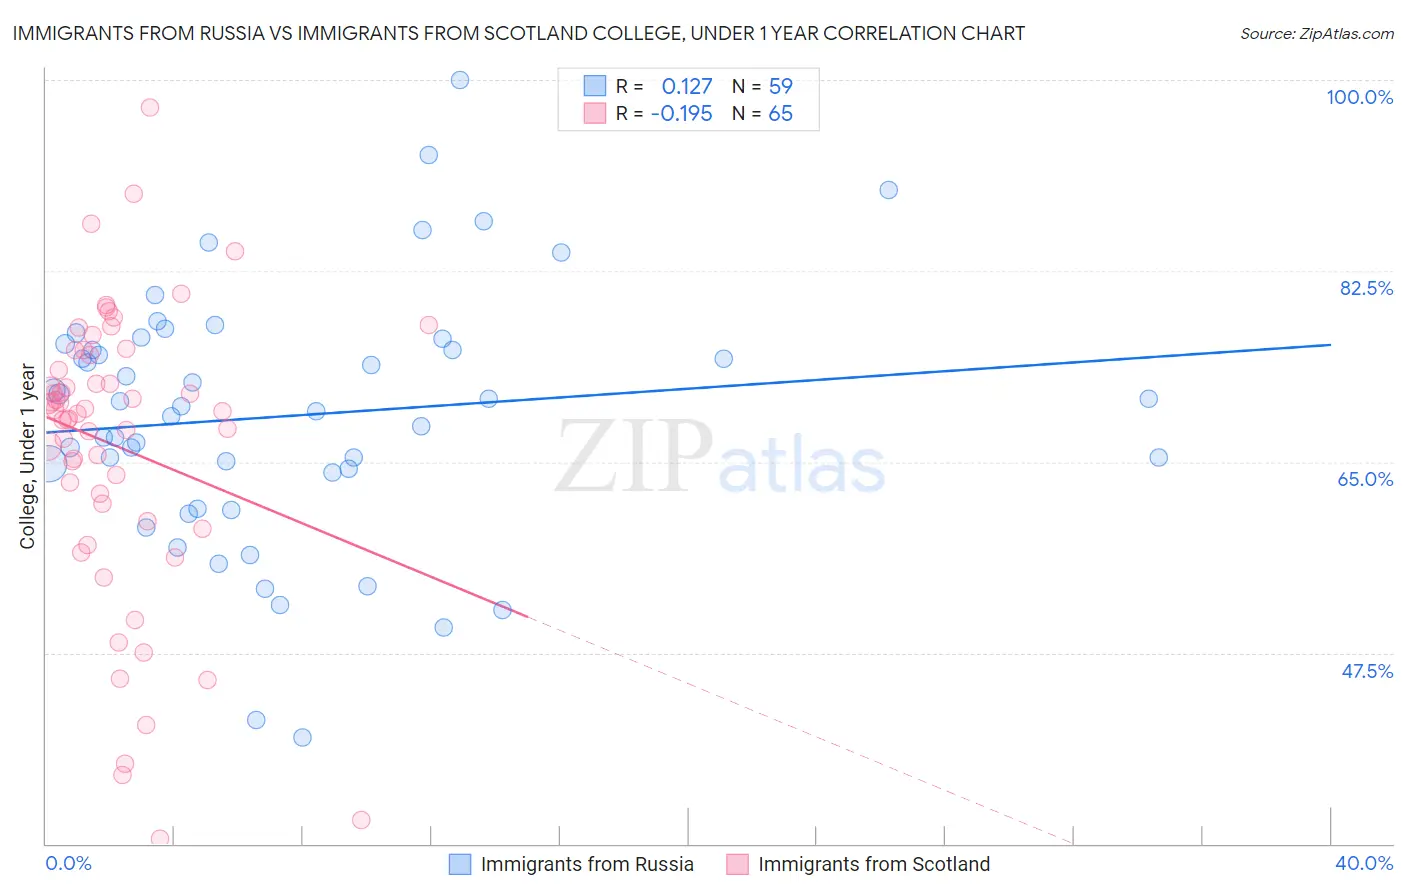
Immigrants from Russia vs Immigrants from Scotland College, Under 1 year Correlation Chart
The statistical analysis conducted on geographies consisting of 347,947,137 people shows a poor positive correlation between the proportion of Immigrants from Russia and percentage of population with at least college, under 1 year education in the United States with a correlation coefficient (R) of 0.127 and weighted average of 69.9%. Similarly, the statistical analysis conducted on geographies consisting of 196,397,263 people shows a poor negative correlation between the proportion of Immigrants from Scotland and percentage of population with at least college, under 1 year education in the United States with a correlation coefficient (R) of -0.195 and weighted average of 69.4%, a difference of 0.62%.
College, Under 1 year Correlation Summary
| Measurement | Immigrants from Russia | Immigrants from Scotland |
| Minimum | 39.8% | 30.5% |
| Maximum | 100.0% | 97.4% |
| Range | 60.2% | 66.9% |
| Mean | 69.2% | 66.4% |
| Median | 70.1% | 69.7% |
| Interquartile 25% (IQ1) | 64.1% | 60.3% |
| Interquartile 75% (IQ3) | 75.8% | 75.1% |
| Interquartile Range (IQR) | 11.8% | 14.7% |
| Standard Deviation (Sample) | 11.7% | 13.4% |
| Standard Deviation (Population) | 11.6% | 13.3% |
Demographics Similar to Immigrants from Russia and Immigrants from Scotland by College, Under 1 year
In terms of college, under 1 year, the demographic groups most similar to Immigrants from Russia are Mongolian (69.9%, a difference of 0.020%), Zimbabwean (69.9%, a difference of 0.060%), Immigrants from Austria (70.0%, a difference of 0.18%), Immigrants from Netherlands (70.0%, a difference of 0.22%), and South African (69.7%, a difference of 0.27%). Similarly, the demographic groups most similar to Immigrants from Scotland are Asian (69.4%, a difference of 0.020%), Maltese (69.5%, a difference of 0.12%), Immigrants from Malaysia (69.3%, a difference of 0.12%), Immigrants from Czechoslovakia (69.6%, a difference of 0.22%), and Immigrants from Serbia (69.3%, a difference of 0.25%).
| Demographics | Rating | Rank | College, Under 1 year |
| New Zealanders | 99.9 /100 | #44 | Exceptional 70.2% |
| Immigrants | Norway | 99.9 /100 | #45 | Exceptional 70.2% |
| Immigrants | Latvia | 99.9 /100 | #46 | Exceptional 70.1% |
| Immigrants | Bulgaria | 99.8 /100 | #47 | Exceptional 70.0% |
| Immigrants | Netherlands | 99.8 /100 | #48 | Exceptional 70.0% |
| Immigrants | Austria | 99.8 /100 | #49 | Exceptional 70.0% |
| Zimbabweans | 99.8 /100 | #50 | Exceptional 69.9% |
| Mongolians | 99.8 /100 | #51 | Exceptional 69.9% |
| Immigrants | Russia | 99.8 /100 | #52 | Exceptional 69.9% |
| South Africans | 99.7 /100 | #53 | Exceptional 69.7% |
| Immigrants | Czechoslovakia | 99.7 /100 | #54 | Exceptional 69.6% |
| Maltese | 99.7 /100 | #55 | Exceptional 69.5% |
| Immigrants | Scotland | 99.6 /100 | #56 | Exceptional 69.4% |
| Asians | 99.6 /100 | #57 | Exceptional 69.4% |
| Immigrants | Malaysia | 99.6 /100 | #58 | Exceptional 69.3% |
| Immigrants | Serbia | 99.5 /100 | #59 | Exceptional 69.3% |
| Immigrants | Asia | 99.5 /100 | #60 | Exceptional 69.2% |
| Immigrants | Kazakhstan | 99.5 /100 | #61 | Exceptional 69.2% |
| Immigrants | Belarus | 99.5 /100 | #62 | Exceptional 69.2% |
| Immigrants | Canada | 99.4 /100 | #63 | Exceptional 69.1% |
| Northern Europeans | 99.4 /100 | #64 | Exceptional 69.0% |