Immigrants from Morocco vs Immigrants from South Eastern Asia Bachelor's Degree
COMPARE
Immigrants from Morocco
Immigrants from South Eastern Asia
Bachelor's Degree
Bachelor's Degree Comparison
Immigrants from Morocco
Immigrants from South Eastern Asia
41.4%
BACHELOR'S DEGREE
98.0/ 100
METRIC RATING
101st/ 347
METRIC RANK
36.8%
BACHELOR'S DEGREE
25.4/ 100
METRIC RATING
201st/ 347
METRIC RANK
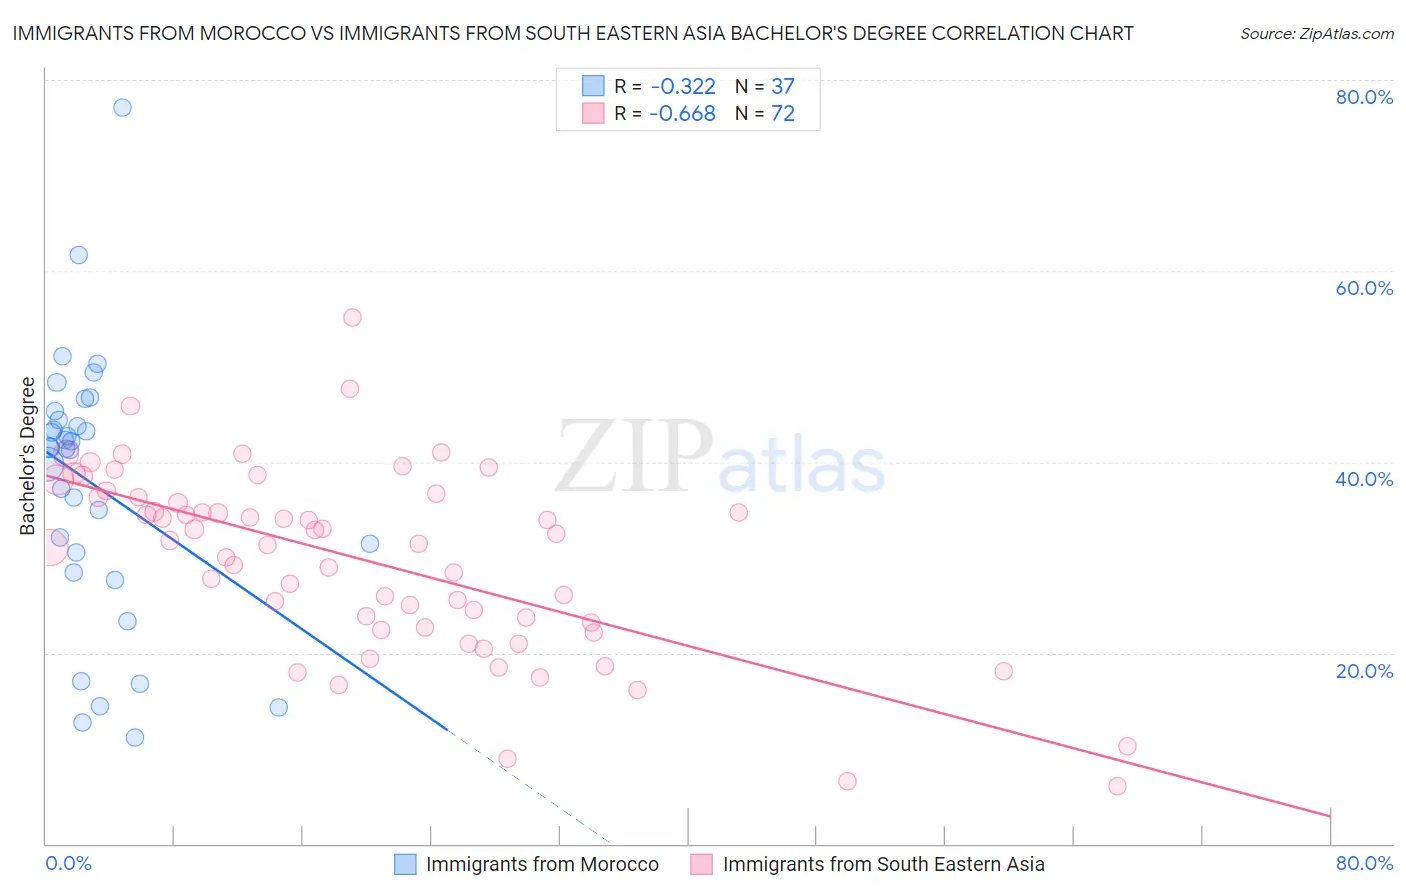
Immigrants from Morocco vs Immigrants from South Eastern Asia Bachelor's Degree Correlation Chart
The statistical analysis conducted on geographies consisting of 178,912,438 people shows a mild negative correlation between the proportion of Immigrants from Morocco and percentage of population with at least bachelor's degree education in the United States with a correlation coefficient (R) of -0.322 and weighted average of 41.4%. Similarly, the statistical analysis conducted on geographies consisting of 512,639,953 people shows a significant negative correlation between the proportion of Immigrants from South Eastern Asia and percentage of population with at least bachelor's degree education in the United States with a correlation coefficient (R) of -0.668 and weighted average of 36.8%, a difference of 12.5%.
Bachelor's Degree Correlation Summary
| Measurement | Immigrants from Morocco | Immigrants from South Eastern Asia |
| Minimum | 11.1% | 6.0% |
| Maximum | 77.2% | 55.1% |
| Range | 66.0% | 49.1% |
| Mean | 37.7% | 29.7% |
| Median | 41.4% | 31.6% |
| Interquartile 25% (IQ1) | 29.5% | 22.9% |
| Interquartile 75% (IQ3) | 44.9% | 36.3% |
| Interquartile Range (IQR) | 15.4% | 13.4% |
| Standard Deviation (Sample) | 14.0% | 9.7% |
| Standard Deviation (Population) | 13.8% | 9.6% |
Similar Demographics by Bachelor's Degree
Demographics Similar to Immigrants from Morocco by Bachelor's Degree
In terms of bachelor's degree, the demographic groups most similar to Immigrants from Morocco are Macedonian (41.4%, a difference of 0.030%), Immigrants from England (41.4%, a difference of 0.060%), Immigrants from Italy (41.3%, a difference of 0.26%), Immigrants from Ukraine (41.5%, a difference of 0.29%), and Romanian (41.6%, a difference of 0.40%).
| Demographics | Rating | Rank | Bachelor's Degree |
| Immigrants | Nepal | 98.6 /100 | #94 | Exceptional 41.7% |
| Immigrants | North America | 98.5 /100 | #95 | Exceptional 41.7% |
| Immigrants | Moldova | 98.4 /100 | #96 | Exceptional 41.6% |
| Romanians | 98.4 /100 | #97 | Exceptional 41.6% |
| Immigrants | Ukraine | 98.3 /100 | #98 | Exceptional 41.5% |
| Immigrants | England | 98.1 /100 | #99 | Exceptional 41.4% |
| Macedonians | 98.1 /100 | #100 | Exceptional 41.4% |
| Immigrants | Morocco | 98.0 /100 | #101 | Exceptional 41.4% |
| Immigrants | Italy | 97.8 /100 | #102 | Exceptional 41.3% |
| Chileans | 97.5 /100 | #103 | Exceptional 41.2% |
| Jordanians | 97.4 /100 | #104 | Exceptional 41.2% |
| Syrians | 97.4 /100 | #105 | Exceptional 41.1% |
| Alsatians | 97.0 /100 | #106 | Exceptional 41.0% |
| Northern Europeans | 96.8 /100 | #107 | Exceptional 41.0% |
| Ukrainians | 96.6 /100 | #108 | Exceptional 40.9% |
Demographics Similar to Immigrants from South Eastern Asia by Bachelor's Degree
In terms of bachelor's degree, the demographic groups most similar to Immigrants from South Eastern Asia are Immigrants from Zaire (36.8%, a difference of 0.010%), Immigrants from Costa Rica (36.9%, a difference of 0.26%), Immigrants from Ghana (36.9%, a difference of 0.26%), Immigrants from Nigeria (36.7%, a difference of 0.31%), and Immigrants (36.7%, a difference of 0.35%).
| Demographics | Rating | Rank | Bachelor's Degree |
| Belgians | 29.9 /100 | #194 | Fair 37.0% |
| Koreans | 29.8 /100 | #195 | Fair 37.0% |
| Celtics | 29.5 /100 | #196 | Fair 37.0% |
| Czechoslovakians | 29.2 /100 | #197 | Fair 37.0% |
| Welsh | 29.1 /100 | #198 | Fair 37.0% |
| Immigrants | Costa Rica | 27.4 /100 | #199 | Fair 36.9% |
| Immigrants | Ghana | 27.4 /100 | #200 | Fair 36.9% |
| Immigrants | South Eastern Asia | 25.4 /100 | #201 | Fair 36.8% |
| Immigrants | Zaire | 25.3 /100 | #202 | Fair 36.8% |
| Immigrants | Nigeria | 23.1 /100 | #203 | Fair 36.7% |
| Immigrants | Immigrants | 22.8 /100 | #204 | Fair 36.7% |
| Finns | 22.2 /100 | #205 | Fair 36.7% |
| Spaniards | 21.2 /100 | #206 | Fair 36.6% |
| Immigrants | Middle Africa | 20.6 /100 | #207 | Fair 36.6% |
| Immigrants | Thailand | 19.4 /100 | #208 | Poor 36.5% |