Vietnamese vs Immigrants from Japan Master's Degree
COMPARE
Vietnamese
Immigrants from Japan
Master's Degree
Master's Degree Comparison
Vietnamese
Immigrants from Japan
15.8%
MASTER'S DEGREE
85.5/ 100
METRIC RATING
140th/ 347
METRIC RANK
20.0%
MASTER'S DEGREE
100.0/ 100
METRIC RATING
25th/ 347
METRIC RANK
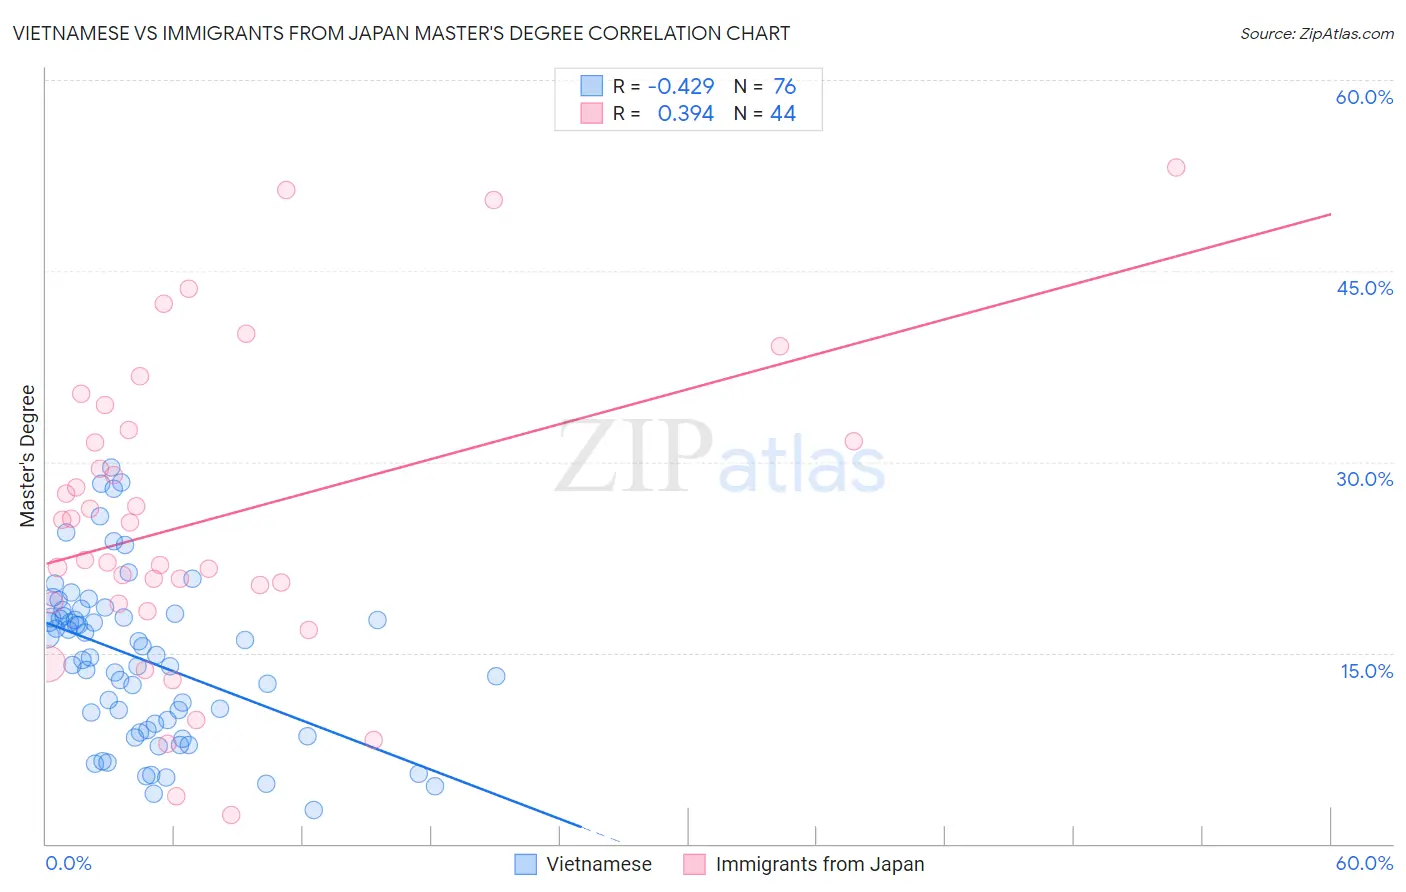
Vietnamese vs Immigrants from Japan Master's Degree Correlation Chart
The statistical analysis conducted on geographies consisting of 170,730,532 people shows a moderate negative correlation between the proportion of Vietnamese and percentage of population with at least master's degree education in the United States with a correlation coefficient (R) of -0.429 and weighted average of 15.8%. Similarly, the statistical analysis conducted on geographies consisting of 340,075,167 people shows a mild positive correlation between the proportion of Immigrants from Japan and percentage of population with at least master's degree education in the United States with a correlation coefficient (R) of 0.394 and weighted average of 20.0%, a difference of 26.9%.
Master's Degree Correlation Summary
| Measurement | Vietnamese | Immigrants from Japan |
| Minimum | 2.6% | 2.2% |
| Maximum | 29.5% | 53.1% |
| Range | 26.9% | 50.9% |
| Mean | 14.5% | 25.5% |
| Median | 14.8% | 23.8% |
| Interquartile 25% (IQ1) | 9.2% | 18.9% |
| Interquartile 75% (IQ3) | 18.0% | 32.1% |
| Interquartile Range (IQR) | 8.8% | 13.2% |
| Standard Deviation (Sample) | 6.4% | 12.0% |
| Standard Deviation (Population) | 6.3% | 11.9% |
Similar Demographics by Master's Degree
Demographics Similar to Vietnamese by Master's Degree
In terms of master's degree, the demographic groups most similar to Vietnamese are Immigrants from Germany (15.8%, a difference of 0.090%), Polish (15.7%, a difference of 0.12%), Pakistani (15.8%, a difference of 0.14%), European (15.8%, a difference of 0.22%), and Assyrian/Chaldean/Syriac (15.8%, a difference of 0.33%).
| Demographics | Rating | Rank | Master's Degree |
| Immigrants | Sudan | 90.2 /100 | #133 | Exceptional 16.0% |
| Venezuelans | 88.4 /100 | #134 | Excellent 15.9% |
| South American Indians | 88.4 /100 | #135 | Excellent 15.9% |
| Assyrians/Chaldeans/Syriacs | 86.8 /100 | #136 | Excellent 15.8% |
| Europeans | 86.4 /100 | #137 | Excellent 15.8% |
| Pakistanis | 86.1 /100 | #138 | Excellent 15.8% |
| Immigrants | Germany | 85.9 /100 | #139 | Excellent 15.8% |
| Vietnamese | 85.5 /100 | #140 | Excellent 15.8% |
| Poles | 85.0 /100 | #141 | Excellent 15.7% |
| Immigrants | Africa | 84.0 /100 | #142 | Excellent 15.7% |
| Immigrants | Venezuela | 83.6 /100 | #143 | Excellent 15.7% |
| Canadians | 83.3 /100 | #144 | Excellent 15.7% |
| South Americans | 81.3 /100 | #145 | Excellent 15.6% |
| Immigrants | Afghanistan | 79.4 /100 | #146 | Good 15.6% |
| Hungarians | 79.1 /100 | #147 | Good 15.6% |
Demographics Similar to Immigrants from Japan by Master's Degree
In terms of master's degree, the demographic groups most similar to Immigrants from Japan are Cambodian (20.0%, a difference of 0.10%), Immigrants from Sri Lanka (19.9%, a difference of 0.51%), Turkish (19.9%, a difference of 0.58%), Latvian (19.8%, a difference of 0.99%), and Immigrants from Sweden (20.3%, a difference of 1.3%).
| Demographics | Rating | Rank | Master's Degree |
| Soviet Union | 100.0 /100 | #18 | Exceptional 20.5% |
| Immigrants | Hong Kong | 100.0 /100 | #19 | Exceptional 20.5% |
| Indians (Asian) | 100.0 /100 | #20 | Exceptional 20.5% |
| Immigrants | Ireland | 100.0 /100 | #21 | Exceptional 20.4% |
| Israelis | 100.0 /100 | #22 | Exceptional 20.3% |
| Immigrants | France | 100.0 /100 | #23 | Exceptional 20.3% |
| Immigrants | Sweden | 100.0 /100 | #24 | Exceptional 20.3% |
| Immigrants | Japan | 100.0 /100 | #25 | Exceptional 20.0% |
| Cambodians | 100.0 /100 | #26 | Exceptional 20.0% |
| Immigrants | Sri Lanka | 100.0 /100 | #27 | Exceptional 19.9% |
| Turks | 100.0 /100 | #28 | Exceptional 19.9% |
| Latvians | 100.0 /100 | #29 | Exceptional 19.8% |
| Immigrants | Turkey | 100.0 /100 | #30 | Exceptional 19.7% |
| Immigrants | Korea | 100.0 /100 | #31 | Exceptional 19.7% |
| Burmese | 100.0 /100 | #32 | Exceptional 19.7% |