Immigrants from Middle Africa vs Immigrants from Japan Seniors Poverty Over the Age of 75
COMPARE
Immigrants from Middle Africa
Immigrants from Japan
Seniors Poverty Over the Age of 75
Seniors Poverty Over the Age of 75 Comparison
Immigrants from Middle Africa
Immigrants from Japan
12.1%
SENIORS POVERTY OVER THE AGE OF 75
61.2/ 100
METRIC RATING
159th/ 347
METRIC RANK
11.6%
SENIORS POVERTY OVER THE AGE OF 75
91.9/ 100
METRIC RATING
98th/ 347
METRIC RANK
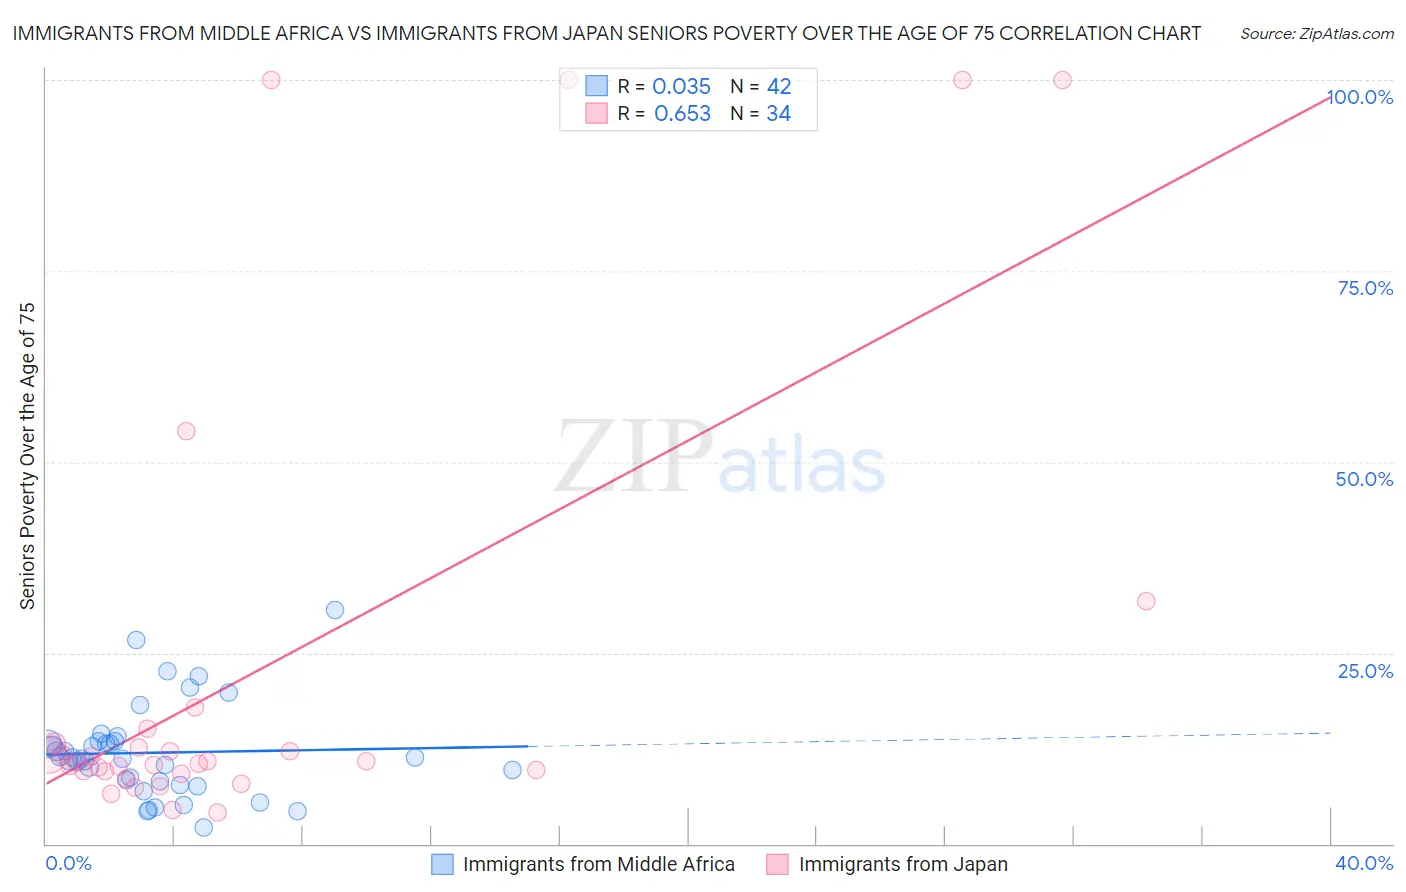
Immigrants from Middle Africa vs Immigrants from Japan Seniors Poverty Over the Age of 75 Correlation Chart
The statistical analysis conducted on geographies consisting of 201,532,689 people shows no correlation between the proportion of Immigrants from Middle Africa and poverty level among seniors over the age of 75 in the United States with a correlation coefficient (R) of 0.035 and weighted average of 12.1%. Similarly, the statistical analysis conducted on geographies consisting of 336,933,586 people shows a significant positive correlation between the proportion of Immigrants from Japan and poverty level among seniors over the age of 75 in the United States with a correlation coefficient (R) of 0.653 and weighted average of 11.6%, a difference of 4.2%.
Seniors Poverty Over the Age of 75 Correlation Summary
| Measurement | Immigrants from Middle Africa | Immigrants from Japan |
| Minimum | 2.1% | 4.0% |
| Maximum | 30.6% | 100.0% |
| Range | 28.5% | 96.0% |
| Mean | 11.9% | 22.7% |
| Median | 11.2% | 10.7% |
| Interquartile 25% (IQ1) | 8.1% | 9.4% |
| Interquartile 75% (IQ3) | 13.4% | 13.1% |
| Interquartile Range (IQR) | 5.2% | 3.7% |
| Standard Deviation (Sample) | 6.1% | 29.9% |
| Standard Deviation (Population) | 6.0% | 29.5% |
Similar Demographics by Seniors Poverty Over the Age of 75
Demographics Similar to Immigrants from Middle Africa by Seniors Poverty Over the Age of 75
In terms of seniors poverty over the age of 75, the demographic groups most similar to Immigrants from Middle Africa are Portuguese (12.1%, a difference of 0.010%), Immigrants from Eastern Africa (12.1%, a difference of 0.030%), Immigrants from Sudan (12.1%, a difference of 0.040%), Immigrants from Norway (12.1%, a difference of 0.050%), and Immigrants from Serbia (12.1%, a difference of 0.080%).
| Demographics | Rating | Rank | Seniors Poverty Over the Age of 75 |
| Immigrants | Korea | 65.5 /100 | #152 | Good 12.0% |
| Immigrants | Turkey | 64.7 /100 | #153 | Good 12.0% |
| Cambodians | 64.0 /100 | #154 | Good 12.0% |
| Indonesians | 62.6 /100 | #155 | Good 12.1% |
| Immigrants | Burma/Myanmar | 62.3 /100 | #156 | Good 12.1% |
| Immigrants | Sudan | 61.7 /100 | #157 | Good 12.1% |
| Portuguese | 61.3 /100 | #158 | Good 12.1% |
| Immigrants | Middle Africa | 61.2 /100 | #159 | Good 12.1% |
| Immigrants | Eastern Africa | 60.9 /100 | #160 | Good 12.1% |
| Immigrants | Norway | 60.6 /100 | #161 | Good 12.1% |
| Immigrants | Serbia | 60.2 /100 | #162 | Good 12.1% |
| Immigrants | Greece | 58.2 /100 | #163 | Average 12.1% |
| Potawatomi | 57.4 /100 | #164 | Average 12.1% |
| Okinawans | 56.3 /100 | #165 | Average 12.1% |
| Egyptians | 54.8 /100 | #166 | Average 12.1% |
Demographics Similar to Immigrants from Japan by Seniors Poverty Over the Age of 75
In terms of seniors poverty over the age of 75, the demographic groups most similar to Immigrants from Japan are Immigrants from Ethiopia (11.6%, a difference of 0.070%), Romanian (11.6%, a difference of 0.11%), Immigrants from Bosnia and Herzegovina (11.6%, a difference of 0.20%), Immigrants from Sweden (11.6%, a difference of 0.20%), and Syrian (11.6%, a difference of 0.23%).
| Demographics | Rating | Rank | Seniors Poverty Over the Age of 75 |
| Immigrants | Germany | 94.1 /100 | #91 | Exceptional 11.5% |
| Kenyans | 93.9 /100 | #92 | Exceptional 11.5% |
| Immigrants | Poland | 92.9 /100 | #93 | Exceptional 11.6% |
| Creek | 92.7 /100 | #94 | Exceptional 11.6% |
| Immigrants | Bosnia and Herzegovina | 92.6 /100 | #95 | Exceptional 11.6% |
| Immigrants | Sweden | 92.6 /100 | #96 | Exceptional 11.6% |
| Romanians | 92.3 /100 | #97 | Exceptional 11.6% |
| Immigrants | Japan | 91.9 /100 | #98 | Exceptional 11.6% |
| Immigrants | Ethiopia | 91.7 /100 | #99 | Exceptional 11.6% |
| Syrians | 91.1 /100 | #100 | Exceptional 11.6% |
| Jordanians | 90.8 /100 | #101 | Exceptional 11.6% |
| Guamanians/Chamorros | 90.6 /100 | #102 | Exceptional 11.6% |
| Immigrants | Kuwait | 90.5 /100 | #103 | Exceptional 11.6% |
| Immigrants | Singapore | 90.3 /100 | #104 | Exceptional 11.6% |
| Chickasaw | 90.2 /100 | #105 | Exceptional 11.6% |