Immigrants from Micronesia vs Spanish American Indian College, Under 1 year
COMPARE
Immigrants from Micronesia
Spanish American Indian
College, Under 1 year
College, Under 1 year Comparison
Immigrants from Micronesia
Spanish American Indians
61.5%
COLLEGE, UNDER 1 YEAR
0.5/ 100
METRIC RATING
251st/ 347
METRIC RANK
54.0%
COLLEGE, UNDER 1 YEAR
0.0/ 100
METRIC RATING
340th/ 347
METRIC RANK
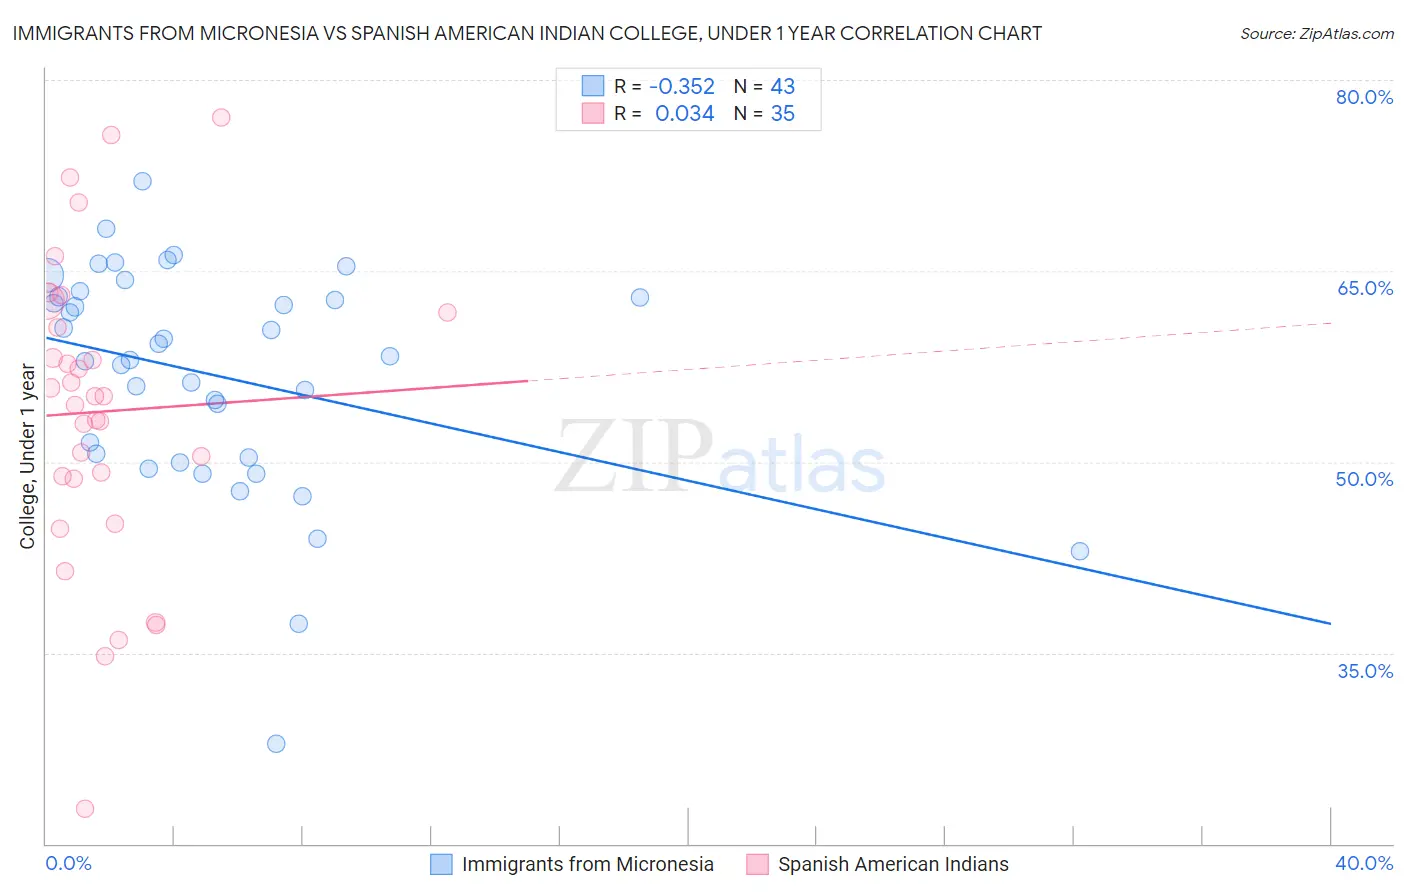
Immigrants from Micronesia vs Spanish American Indian College, Under 1 year Correlation Chart
The statistical analysis conducted on geographies consisting of 61,608,832 people shows a mild negative correlation between the proportion of Immigrants from Micronesia and percentage of population with at least college, under 1 year education in the United States with a correlation coefficient (R) of -0.352 and weighted average of 61.5%. Similarly, the statistical analysis conducted on geographies consisting of 73,150,359 people shows no correlation between the proportion of Spanish American Indians and percentage of population with at least college, under 1 year education in the United States with a correlation coefficient (R) of 0.034 and weighted average of 54.0%, a difference of 14.1%.
College, Under 1 year Correlation Summary
| Measurement | Immigrants from Micronesia | Spanish American Indian |
| Minimum | 27.9% | 22.8% |
| Maximum | 72.0% | 77.0% |
| Range | 44.1% | 54.2% |
| Mean | 56.9% | 53.9% |
| Median | 58.3% | 55.2% |
| Interquartile 25% (IQ1) | 50.3% | 48.7% |
| Interquartile 75% (IQ3) | 63.0% | 61.8% |
| Interquartile Range (IQR) | 12.7% | 13.1% |
| Standard Deviation (Sample) | 8.8% | 11.9% |
| Standard Deviation (Population) | 8.7% | 11.7% |
Similar Demographics by College, Under 1 year
Demographics Similar to Immigrants from Micronesia by College, Under 1 year
In terms of college, under 1 year, the demographic groups most similar to Immigrants from Micronesia are West Indian (61.5%, a difference of 0.11%), Japanese (61.5%, a difference of 0.11%), Immigrants from Cambodia (61.5%, a difference of 0.11%), Vietnamese (61.7%, a difference of 0.19%), and Immigrants from Congo (61.7%, a difference of 0.19%).
| Demographics | Rating | Rank | College, Under 1 year |
| Colville | 1.0 /100 | #244 | Tragic 62.1% |
| Delaware | 0.9 /100 | #245 | Tragic 62.1% |
| Marshallese | 0.8 /100 | #246 | Tragic 61.9% |
| Immigrants | Liberia | 0.8 /100 | #247 | Tragic 61.9% |
| Potawatomi | 0.6 /100 | #248 | Tragic 61.8% |
| Vietnamese | 0.5 /100 | #249 | Tragic 61.7% |
| Immigrants | Congo | 0.5 /100 | #250 | Tragic 61.7% |
| Immigrants | Micronesia | 0.5 /100 | #251 | Tragic 61.5% |
| West Indians | 0.4 /100 | #252 | Tragic 61.5% |
| Japanese | 0.4 /100 | #253 | Tragic 61.5% |
| Immigrants | Cambodia | 0.4 /100 | #254 | Tragic 61.5% |
| Comanche | 0.4 /100 | #255 | Tragic 61.4% |
| Bangladeshis | 0.4 /100 | #256 | Tragic 61.4% |
| Immigrants | Laos | 0.3 /100 | #257 | Tragic 61.3% |
| Immigrants | Bangladesh | 0.3 /100 | #258 | Tragic 61.3% |
Demographics Similar to Spanish American Indians by College, Under 1 year
In terms of college, under 1 year, the demographic groups most similar to Spanish American Indians are Immigrants from Dominican Republic (54.0%, a difference of 0.090%), Lumbee (54.2%, a difference of 0.49%), Immigrants from Cabo Verde (53.7%, a difference of 0.51%), Immigrants from Mexico (53.7%, a difference of 0.57%), and Immigrants from Central America (54.4%, a difference of 0.90%).
| Demographics | Rating | Rank | College, Under 1 year |
| Yuman | 0.0 /100 | #333 | Tragic 55.1% |
| Immigrants | Azores | 0.0 /100 | #334 | Tragic 54.7% |
| Inupiat | 0.0 /100 | #335 | Tragic 54.6% |
| Pennsylvania Germans | 0.0 /100 | #336 | Tragic 54.5% |
| Immigrants | Central America | 0.0 /100 | #337 | Tragic 54.4% |
| Lumbee | 0.0 /100 | #338 | Tragic 54.2% |
| Immigrants | Dominican Republic | 0.0 /100 | #339 | Tragic 54.0% |
| Spanish American Indians | 0.0 /100 | #340 | Tragic 54.0% |
| Immigrants | Cabo Verde | 0.0 /100 | #341 | Tragic 53.7% |
| Immigrants | Mexico | 0.0 /100 | #342 | Tragic 53.7% |
| Tohono O'odham | 0.0 /100 | #343 | Tragic 52.8% |
| Yakama | 0.0 /100 | #344 | Tragic 52.6% |
| Pima | 0.0 /100 | #345 | Tragic 51.4% |
| Houma | 0.0 /100 | #346 | Tragic 47.6% |
| Yup'ik | 0.0 /100 | #347 | Tragic 45.8% |