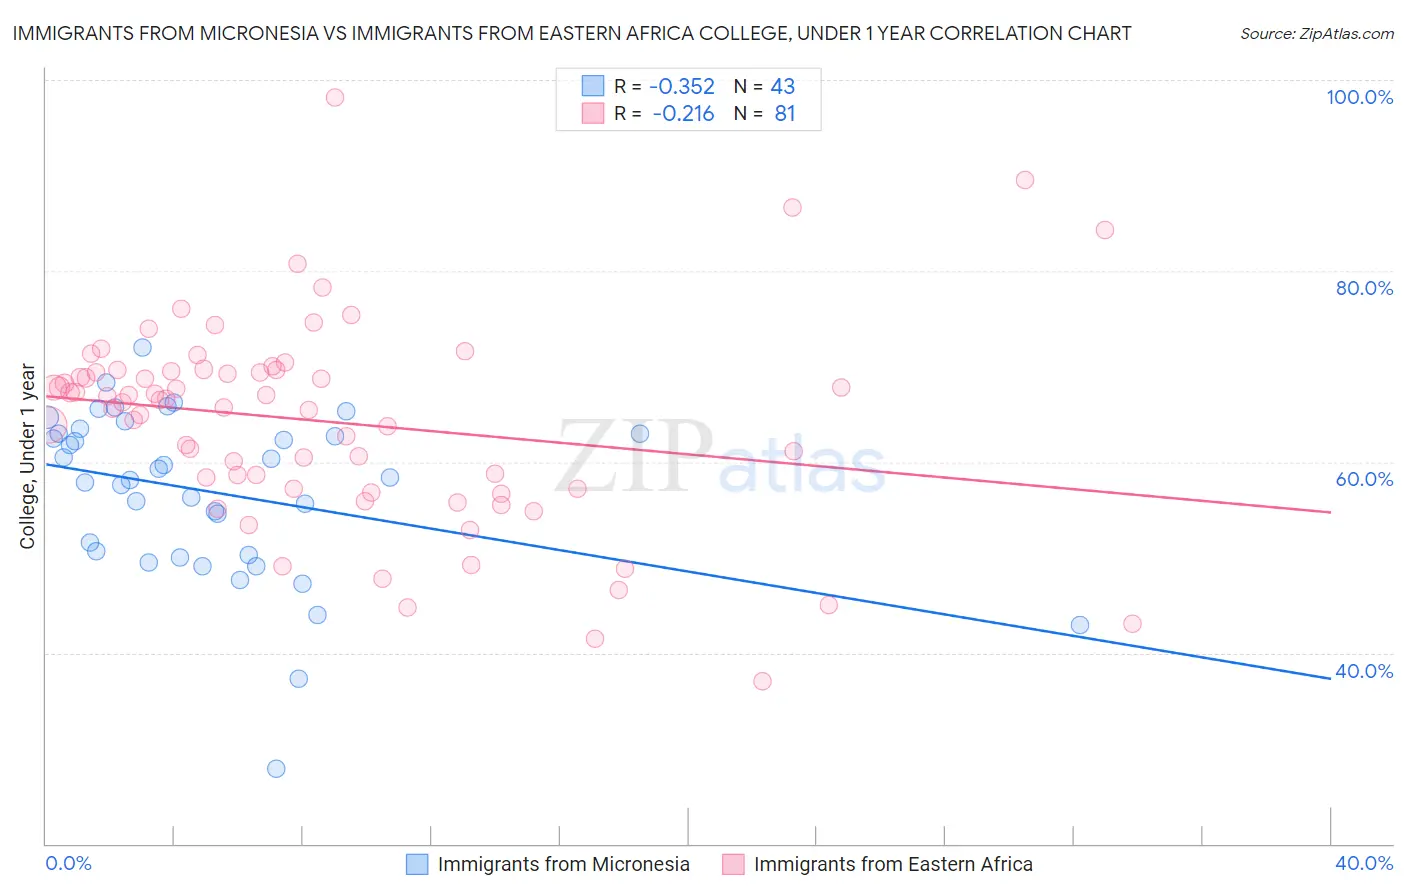
Immigrants from Micronesia vs Immigrants from Eastern Africa College, Under 1 year
COMPARE
Immigrants from Micronesia
Immigrants from Eastern Africa
College, Under 1 year
College, Under 1 year Comparison
Immigrants from Micronesia
Immigrants from Eastern Africa
61.5%
COLLEGE, UNDER 1 YEAR
0.5/ 100
METRIC RATING
251st/ 347
METRIC RANK
67.0%
COLLEGE, UNDER 1 YEAR
89.5/ 100
METRIC RATING
129th/ 347
METRIC RANK
Immigrants from Micronesia vs Immigrants from Eastern Africa College, Under 1 year Correlation Chart
The statistical analysis conducted on geographies consisting of 61,608,832 people shows a mild negative correlation between the proportion of Immigrants from Micronesia and percentage of population with at least college, under 1 year education in the United States with a correlation coefficient (R) of -0.352 and weighted average of 61.5%. Similarly, the statistical analysis conducted on geographies consisting of 355,150,980 people shows a weak negative correlation between the proportion of Immigrants from Eastern Africa and percentage of population with at least college, under 1 year education in the United States with a correlation coefficient (R) of -0.216 and weighted average of 67.0%, a difference of 8.8%.
College, Under 1 year Correlation Summary
| Measurement | Immigrants from Micronesia | Immigrants from Eastern Africa |
| Minimum | 27.9% | 37.0% |
| Maximum | 72.0% | 98.2% |
| Range | 44.1% | 61.2% |
| Mean | 56.9% | 64.2% |
| Median | 58.3% | 66.5% |
| Interquartile 25% (IQ1) | 50.3% | 57.2% |
| Interquartile 75% (IQ3) | 63.0% | 69.5% |
| Interquartile Range (IQR) | 12.7% | 12.4% |
| Standard Deviation (Sample) | 8.8% | 10.7% |
| Standard Deviation (Population) | 8.7% | 10.7% |
Similar Demographics by College, Under 1 year
Demographics Similar to Immigrants from Micronesia by College, Under 1 year
In terms of college, under 1 year, the demographic groups most similar to Immigrants from Micronesia are West Indian (61.5%, a difference of 0.11%), Japanese (61.5%, a difference of 0.11%), Immigrants from Cambodia (61.5%, a difference of 0.11%), Vietnamese (61.7%, a difference of 0.19%), and Immigrants from Congo (61.7%, a difference of 0.19%).
| Demographics | Rating | Rank | College, Under 1 year |
| Colville | 1.0 /100 | #244 | Tragic 62.1% |
| Delaware | 0.9 /100 | #245 | Tragic 62.1% |
| Marshallese | 0.8 /100 | #246 | Tragic 61.9% |
| Immigrants | Liberia | 0.8 /100 | #247 | Tragic 61.9% |
| Potawatomi | 0.6 /100 | #248 | Tragic 61.8% |
| Vietnamese | 0.5 /100 | #249 | Tragic 61.7% |
| Immigrants | Congo | 0.5 /100 | #250 | Tragic 61.7% |
| Immigrants | Micronesia | 0.5 /100 | #251 | Tragic 61.5% |
| West Indians | 0.4 /100 | #252 | Tragic 61.5% |
| Japanese | 0.4 /100 | #253 | Tragic 61.5% |
| Immigrants | Cambodia | 0.4 /100 | #254 | Tragic 61.5% |
| Comanche | 0.4 /100 | #255 | Tragic 61.4% |
| Bangladeshis | 0.4 /100 | #256 | Tragic 61.4% |
| Immigrants | Laos | 0.3 /100 | #257 | Tragic 61.3% |
| Immigrants | Bangladesh | 0.3 /100 | #258 | Tragic 61.3% |
Demographics Similar to Immigrants from Eastern Africa by College, Under 1 year
In terms of college, under 1 year, the demographic groups most similar to Immigrants from Eastern Africa are Immigrants from Syria (66.9%, a difference of 0.060%), Scottish (67.0%, a difference of 0.080%), Finnish (66.9%, a difference of 0.10%), Polish (66.9%, a difference of 0.12%), and Immigrants from Brazil (66.9%, a difference of 0.14%).
| Demographics | Rating | Rank | College, Under 1 year |
| Immigrants | Jordan | 92.8 /100 | #122 | Exceptional 67.3% |
| Immigrants | Northern Africa | 92.7 /100 | #123 | Exceptional 67.2% |
| Arabs | 92.6 /100 | #124 | Exceptional 67.2% |
| Italians | 91.8 /100 | #125 | Exceptional 67.2% |
| Alsatians | 91.3 /100 | #126 | Exceptional 67.1% |
| Czechs | 90.8 /100 | #127 | Exceptional 67.1% |
| Scottish | 90.2 /100 | #128 | Exceptional 67.0% |
| Immigrants | Eastern Africa | 89.5 /100 | #129 | Excellent 67.0% |
| Immigrants | Syria | 89.0 /100 | #130 | Excellent 66.9% |
| Finns | 88.6 /100 | #131 | Excellent 66.9% |
| Poles | 88.4 /100 | #132 | Excellent 66.9% |
| Immigrants | Brazil | 88.3 /100 | #133 | Excellent 66.9% |
| Iraqis | 88.0 /100 | #134 | Excellent 66.8% |
| Canadians | 87.9 /100 | #135 | Excellent 66.8% |
| Ugandans | 87.8 /100 | #136 | Excellent 66.8% |