Immigrants from Latvia vs Romanian In Labor Force | Age > 16
COMPARE
Immigrants from Latvia
Romanian
In Labor Force | Age > 16
In Labor Force | Age > 16 Comparison
Immigrants from Latvia
Romanians
65.1%
IN LABOR FORCE | AGE > 16
42.9/ 100
METRIC RATING
180th/ 347
METRIC RANK
65.0%
IN LABOR FORCE | AGE > 16
31.1/ 100
METRIC RATING
195th/ 347
METRIC RANK
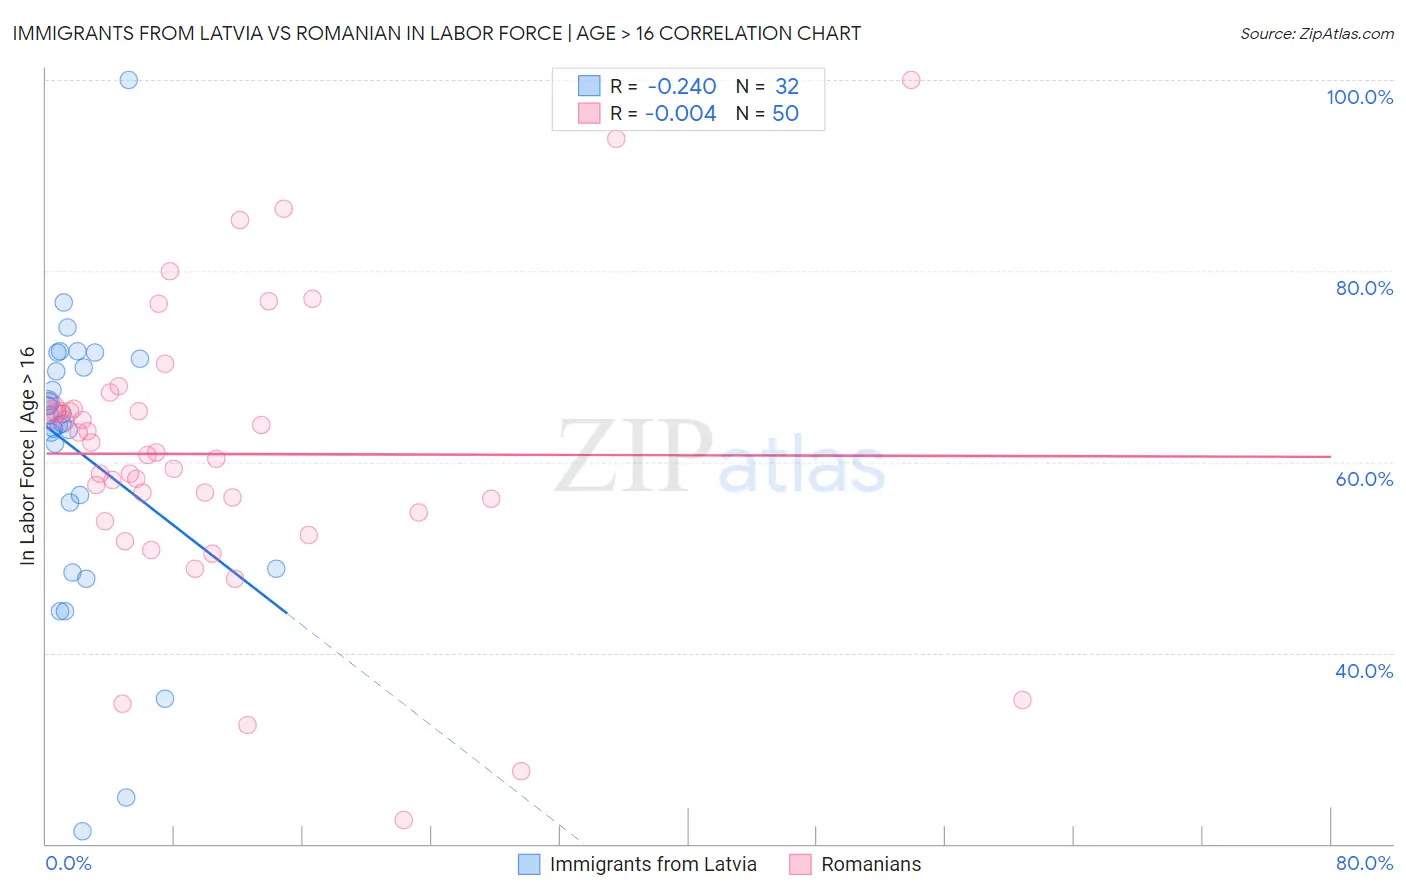
Immigrants from Latvia vs Romanian In Labor Force | Age > 16 Correlation Chart
The statistical analysis conducted on geographies consisting of 113,739,608 people shows a weak negative correlation between the proportion of Immigrants from Latvia and labor force participation rate among population ages 16 and over in the United States with a correlation coefficient (R) of -0.240 and weighted average of 65.1%. Similarly, the statistical analysis conducted on geographies consisting of 377,921,864 people shows no correlation between the proportion of Romanians and labor force participation rate among population ages 16 and over in the United States with a correlation coefficient (R) of -0.004 and weighted average of 65.0%, a difference of 0.14%.
In Labor Force | Age > 16 Correlation Summary
| Measurement | Immigrants from Latvia | Romanian |
| Minimum | 21.3% | 22.5% |
| Maximum | 100.0% | 100.0% |
| Range | 78.7% | 77.5% |
| Mean | 60.9% | 60.8% |
| Median | 64.5% | 60.9% |
| Interquartile 25% (IQ1) | 52.3% | 54.7% |
| Interquartile 75% (IQ3) | 70.3% | 65.3% |
| Interquartile Range (IQR) | 18.1% | 10.6% |
| Standard Deviation (Sample) | 15.5% | 15.0% |
| Standard Deviation (Population) | 15.3% | 14.8% |
Demographics Similar to Immigrants from Latvia and Romanians by In Labor Force | Age > 16
In terms of in labor force | age > 16, the demographic groups most similar to Immigrants from Latvia are Immigrants from Haiti (65.1%, a difference of 0.0%), Immigrants from Panama (65.1%, a difference of 0.010%), Immigrants from Nicaragua (65.1%, a difference of 0.020%), Trinidadian and Tobagonian (65.1%, a difference of 0.030%), and Soviet Union (65.0%, a difference of 0.030%). Similarly, the demographic groups most similar to Romanians are Immigrants from Southern Europe (65.0%, a difference of 0.0%), Haitian (65.0%, a difference of 0.010%), Scandinavian (65.0%, a difference of 0.030%), Immigrants from Fiji (65.0%, a difference of 0.030%), and Immigrants from Europe (65.0%, a difference of 0.030%).
| Demographics | Rating | Rank | In Labor Force | Age > 16 |
| Eastern Europeans | 46.2 /100 | #177 | Average 65.1% |
| Trinidadians and Tobagonians | 45.2 /100 | #178 | Average 65.1% |
| Immigrants | Haiti | 43.3 /100 | #179 | Average 65.1% |
| Immigrants | Latvia | 42.9 /100 | #180 | Average 65.1% |
| Immigrants | Panama | 42.4 /100 | #181 | Average 65.1% |
| Immigrants | Nicaragua | 41.1 /100 | #182 | Average 65.1% |
| Soviet Union | 40.5 /100 | #183 | Average 65.0% |
| Carpatho Rusyns | 40.0 /100 | #184 | Average 65.0% |
| Syrians | 40.0 /100 | #185 | Average 65.0% |
| Immigrants | Switzerland | 38.2 /100 | #186 | Fair 65.0% |
| Immigrants | Croatia | 35.7 /100 | #187 | Fair 65.0% |
| Immigrants | Portugal | 34.8 /100 | #188 | Fair 65.0% |
| Immigrants | Greece | 34.3 /100 | #189 | Fair 65.0% |
| Barbadians | 33.9 /100 | #190 | Fair 65.0% |
| Scandinavians | 33.7 /100 | #191 | Fair 65.0% |
| Immigrants | Fiji | 33.7 /100 | #192 | Fair 65.0% |
| Immigrants | Europe | 33.6 /100 | #193 | Fair 65.0% |
| Immigrants | Southern Europe | 31.3 /100 | #194 | Fair 65.0% |
| Romanians | 31.1 /100 | #195 | Fair 65.0% |
| Haitians | 30.6 /100 | #196 | Fair 65.0% |
| Immigrants | Italy | 28.7 /100 | #197 | Fair 65.0% |