Immigrants from Latvia vs Laotian 10th Grade
COMPARE
Immigrants from Latvia
Laotian
10th Grade
10th Grade Comparison
Immigrants from Latvia
Laotians
94.7%
10TH GRADE
99.2/ 100
METRIC RATING
81st/ 347
METRIC RANK
93.6%
10TH GRADE
32.1/ 100
METRIC RATING
190th/ 347
METRIC RANK
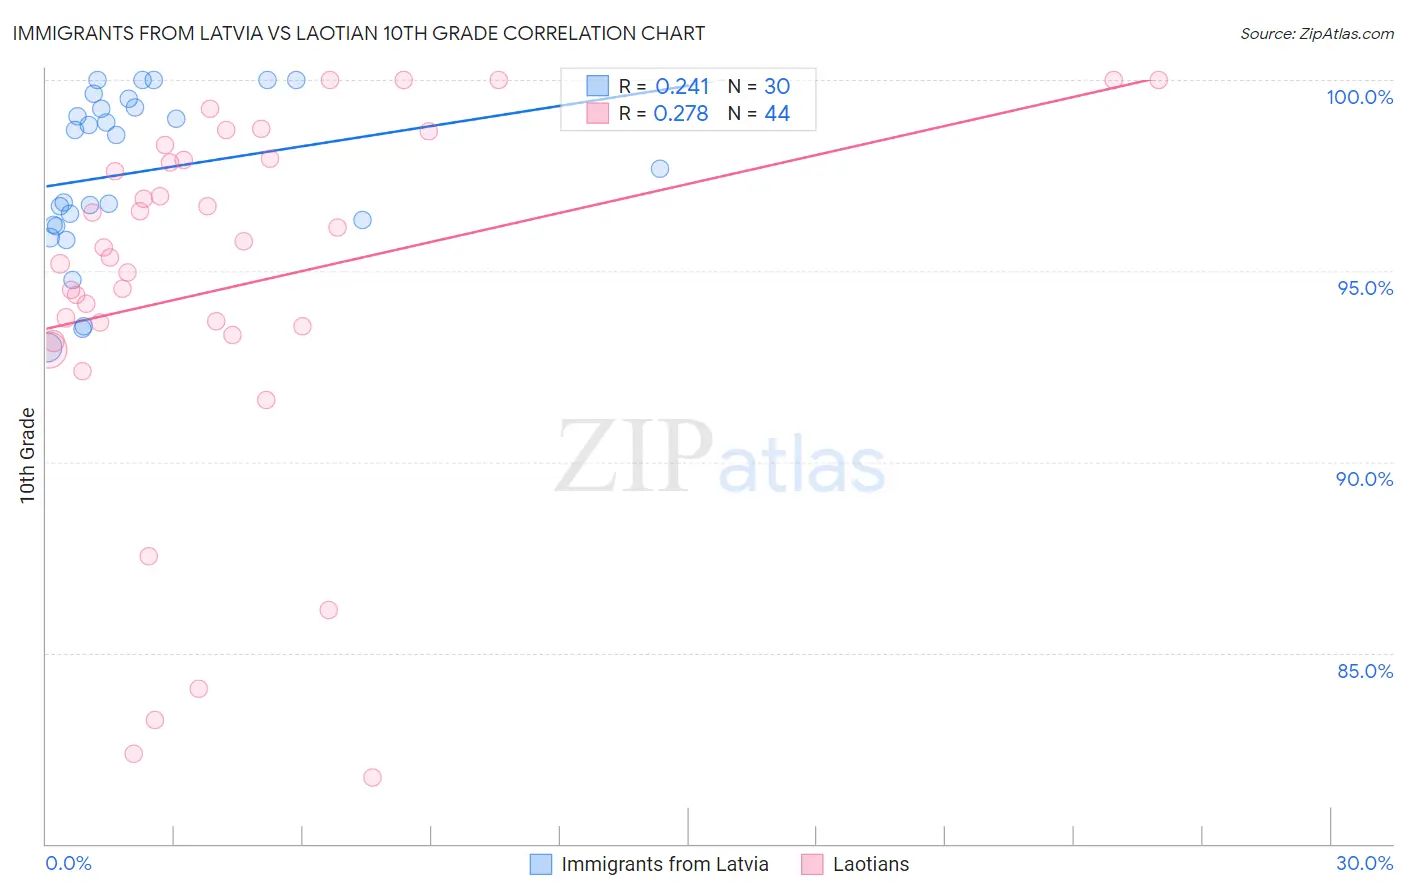
Immigrants from Latvia vs Laotian 10th Grade Correlation Chart
The statistical analysis conducted on geographies consisting of 113,734,781 people shows a weak positive correlation between the proportion of Immigrants from Latvia and percentage of population with at least 10th grade education in the United States with a correlation coefficient (R) of 0.241 and weighted average of 94.7%. Similarly, the statistical analysis conducted on geographies consisting of 224,854,130 people shows a weak positive correlation between the proportion of Laotians and percentage of population with at least 10th grade education in the United States with a correlation coefficient (R) of 0.278 and weighted average of 93.6%, a difference of 1.3%.
10th Grade Correlation Summary
| Measurement | Immigrants from Latvia | Laotian |
| Minimum | 93.0% | 81.7% |
| Maximum | 100.0% | 100.0% |
| Range | 7.0% | 18.3% |
| Mean | 97.6% | 94.6% |
| Median | 98.1% | 95.5% |
| Interquartile 25% (IQ1) | 96.2% | 93.4% |
| Interquartile 75% (IQ3) | 99.3% | 97.9% |
| Interquartile Range (IQR) | 3.1% | 4.5% |
| Standard Deviation (Sample) | 2.1% | 4.8% |
| Standard Deviation (Population) | 2.1% | 4.8% |
Similar Demographics by 10th Grade
Demographics Similar to Immigrants from Latvia by 10th Grade
In terms of 10th grade, the demographic groups most similar to Immigrants from Latvia are Immigrants from Denmark (94.7%, a difference of 0.0%), Immigrants from Czechoslovakia (94.7%, a difference of 0.010%), Swiss (94.7%, a difference of 0.030%), Immigrants from Western Europe (94.7%, a difference of 0.030%), and Filipino (94.8%, a difference of 0.040%).
| Demographics | Rating | Rank | 10th Grade |
| Canadians | 99.6 /100 | #74 | Exceptional 94.9% |
| Okinawans | 99.5 /100 | #75 | Exceptional 94.8% |
| Romanians | 99.5 /100 | #76 | Exceptional 94.8% |
| Immigrants | South Africa | 99.5 /100 | #77 | Exceptional 94.8% |
| Filipinos | 99.3 /100 | #78 | Exceptional 94.8% |
| Immigrants | Czechoslovakia | 99.2 /100 | #79 | Exceptional 94.7% |
| Immigrants | Denmark | 99.2 /100 | #80 | Exceptional 94.7% |
| Immigrants | Latvia | 99.2 /100 | #81 | Exceptional 94.7% |
| Swiss | 99.1 /100 | #82 | Exceptional 94.7% |
| Immigrants | Western Europe | 99.1 /100 | #83 | Exceptional 94.7% |
| Icelanders | 99.1 /100 | #84 | Exceptional 94.7% |
| Crow | 99.0 /100 | #85 | Exceptional 94.7% |
| Puget Sound Salish | 99.0 /100 | #86 | Exceptional 94.7% |
| Immigrants | Saudi Arabia | 99.0 /100 | #87 | Exceptional 94.7% |
| Immigrants | Japan | 99.0 /100 | #88 | Exceptional 94.7% |
Demographics Similar to Laotians by 10th Grade
In terms of 10th grade, the demographic groups most similar to Laotians are Immigrants from Pakistan (93.6%, a difference of 0.0%), Marshallese (93.6%, a difference of 0.010%), Yup'ik (93.6%, a difference of 0.010%), Immigrants from Eastern Asia (93.6%, a difference of 0.030%), and Liberian (93.6%, a difference of 0.030%).
| Demographics | Rating | Rank | 10th Grade |
| Guamanians/Chamorros | 37.1 /100 | #183 | Fair 93.6% |
| Choctaw | 36.6 /100 | #184 | Fair 93.6% |
| Sudanese | 36.6 /100 | #185 | Fair 93.6% |
| Immigrants | Eastern Asia | 35.1 /100 | #186 | Fair 93.6% |
| Liberians | 34.7 /100 | #187 | Fair 93.6% |
| Marshallese | 33.2 /100 | #188 | Fair 93.6% |
| Immigrants | Pakistan | 32.5 /100 | #189 | Fair 93.6% |
| Laotians | 32.1 /100 | #190 | Fair 93.6% |
| Yup'ik | 31.1 /100 | #191 | Fair 93.6% |
| Immigrants | Malaysia | 28.0 /100 | #192 | Fair 93.5% |
| Panamanians | 28.0 /100 | #193 | Fair 93.5% |
| Immigrants | Morocco | 26.9 /100 | #194 | Fair 93.5% |
| Cheyenne | 26.8 /100 | #195 | Fair 93.5% |
| Moroccans | 25.3 /100 | #196 | Fair 93.5% |
| Pueblo | 23.9 /100 | #197 | Fair 93.5% |