Immigrants from Latvia vs Puget Sound Salish Female Poverty Among 25-34 Year Olds
COMPARE
Immigrants from Latvia
Puget Sound Salish
Female Poverty Among 25-34 Year Olds
Female Poverty Among 25-34 Year Olds Comparison
Immigrants from Latvia
Puget Sound Salish
12.5%
FEMALE POVERTY AMONG 25-34 YEAR OLDS
97.7/ 100
METRIC RATING
84th/ 347
METRIC RANK
14.3%
FEMALE POVERTY AMONG 25-34 YEAR OLDS
6.5/ 100
METRIC RATING
213th/ 347
METRIC RANK
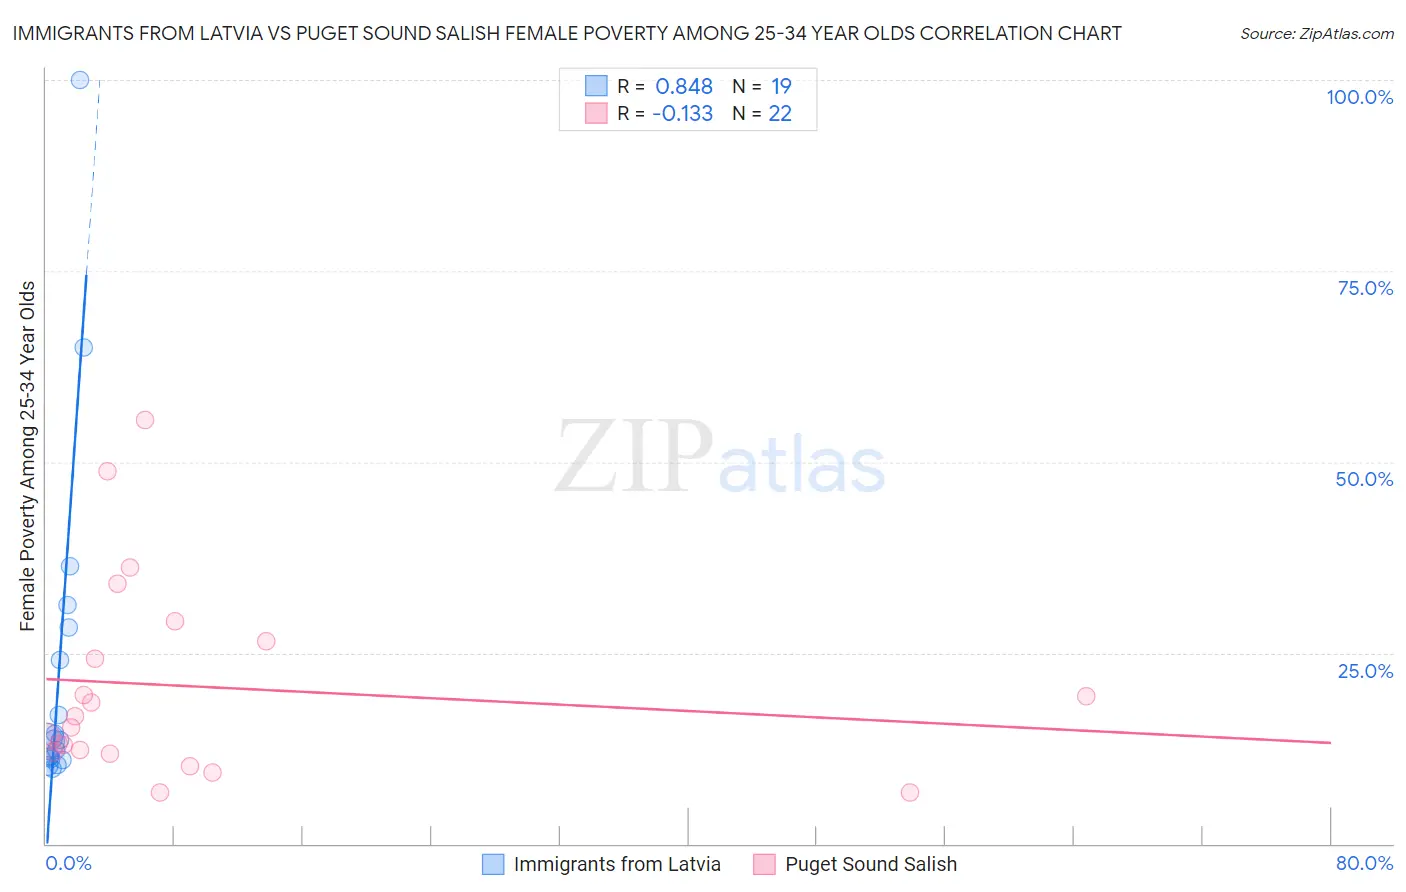
Immigrants from Latvia vs Puget Sound Salish Female Poverty Among 25-34 Year Olds Correlation Chart
The statistical analysis conducted on geographies consisting of 113,031,058 people shows a very strong positive correlation between the proportion of Immigrants from Latvia and poverty level among females between the ages 25 and 34 in the United States with a correlation coefficient (R) of 0.848 and weighted average of 12.5%. Similarly, the statistical analysis conducted on geographies consisting of 45,969,058 people shows a poor negative correlation between the proportion of Puget Sound Salish and poverty level among females between the ages 25 and 34 in the United States with a correlation coefficient (R) of -0.133 and weighted average of 14.3%, a difference of 14.4%.
Female Poverty Among 25-34 Year Olds Correlation Summary
| Measurement | Immigrants from Latvia | Puget Sound Salish |
| Minimum | 9.8% | 6.7% |
| Maximum | 100.0% | 55.5% |
| Range | 90.2% | 48.8% |
| Mean | 23.4% | 20.6% |
| Median | 13.6% | 16.0% |
| Interquartile 25% (IQ1) | 11.1% | 12.0% |
| Interquartile 75% (IQ3) | 28.4% | 26.6% |
| Interquartile Range (IQR) | 17.3% | 14.5% |
| Standard Deviation (Sample) | 23.0% | 13.1% |
| Standard Deviation (Population) | 22.4% | 12.8% |
Similar Demographics by Female Poverty Among 25-34 Year Olds
Demographics Similar to Immigrants from Latvia by Female Poverty Among 25-34 Year Olds
In terms of female poverty among 25-34 year olds, the demographic groups most similar to Immigrants from Latvia are Albanian (12.5%, a difference of 0.060%), Immigrants from South Eastern Asia (12.5%, a difference of 0.11%), Croatian (12.5%, a difference of 0.13%), Argentinean (12.5%, a difference of 0.15%), and Immigrants from Austria (12.5%, a difference of 0.23%).
| Demographics | Rating | Rank | Female Poverty Among 25-34 Year Olds |
| Immigrants | Italy | 98.8 /100 | #77 | Exceptional 12.3% |
| Immigrants | Ukraine | 98.6 /100 | #78 | Exceptional 12.3% |
| Immigrants | Jordan | 98.5 /100 | #79 | Exceptional 12.4% |
| Immigrants | Malaysia | 98.3 /100 | #80 | Exceptional 12.4% |
| Immigrants | Kazakhstan | 98.1 /100 | #81 | Exceptional 12.4% |
| Ethiopians | 98.0 /100 | #82 | Exceptional 12.4% |
| Albanians | 97.7 /100 | #83 | Exceptional 12.5% |
| Immigrants | Latvia | 97.7 /100 | #84 | Exceptional 12.5% |
| Immigrants | South Eastern Asia | 97.6 /100 | #85 | Exceptional 12.5% |
| Croatians | 97.5 /100 | #86 | Exceptional 12.5% |
| Argentineans | 97.5 /100 | #87 | Exceptional 12.5% |
| Immigrants | Austria | 97.4 /100 | #88 | Exceptional 12.5% |
| Italians | 97.2 /100 | #89 | Exceptional 12.5% |
| Immigrants | Albania | 97.1 /100 | #90 | Exceptional 12.5% |
| Norwegians | 96.9 /100 | #91 | Exceptional 12.6% |
Demographics Similar to Puget Sound Salish by Female Poverty Among 25-34 Year Olds
In terms of female poverty among 25-34 year olds, the demographic groups most similar to Puget Sound Salish are Immigrants from Guyana (14.3%, a difference of 0.030%), French (14.3%, a difference of 0.10%), Immigrants from Nigeria (14.3%, a difference of 0.12%), French Canadian (14.3%, a difference of 0.37%), and Spanish American Indian (14.3%, a difference of 0.38%).
| Demographics | Rating | Rank | Female Poverty Among 25-34 Year Olds |
| Hungarians | 11.8 /100 | #206 | Poor 14.1% |
| Japanese | 11.7 /100 | #207 | Poor 14.1% |
| Immigrants | Panama | 11.6 /100 | #208 | Poor 14.1% |
| Guyanese | 8.6 /100 | #209 | Tragic 14.2% |
| Panamanians | 8.6 /100 | #210 | Tragic 14.2% |
| Trinidadians and Tobagonians | 8.2 /100 | #211 | Tragic 14.2% |
| Immigrants | Guyana | 6.6 /100 | #212 | Tragic 14.3% |
| Puget Sound Salish | 6.5 /100 | #213 | Tragic 14.3% |
| French | 6.2 /100 | #214 | Tragic 14.3% |
| Immigrants | Nigeria | 6.2 /100 | #215 | Tragic 14.3% |
| French Canadians | 5.5 /100 | #216 | Tragic 14.3% |
| Spanish American Indians | 5.5 /100 | #217 | Tragic 14.3% |
| Immigrants | Thailand | 5.2 /100 | #218 | Tragic 14.3% |
| Ecuadorians | 5.2 /100 | #219 | Tragic 14.3% |
| Ghanaians | 4.8 /100 | #220 | Tragic 14.4% |