Immigrants from Latvia vs Sierra Leonean Kindergarten
COMPARE
Immigrants from Latvia
Sierra Leonean
Kindergarten
Kindergarten Comparison
Immigrants from Latvia
Sierra Leoneans
98.2%
KINDERGARTEN
96.3/ 100
METRIC RATING
113th/ 347
METRIC RANK
97.7%
KINDERGARTEN
3.4/ 100
METRIC RATING
229th/ 347
METRIC RANK
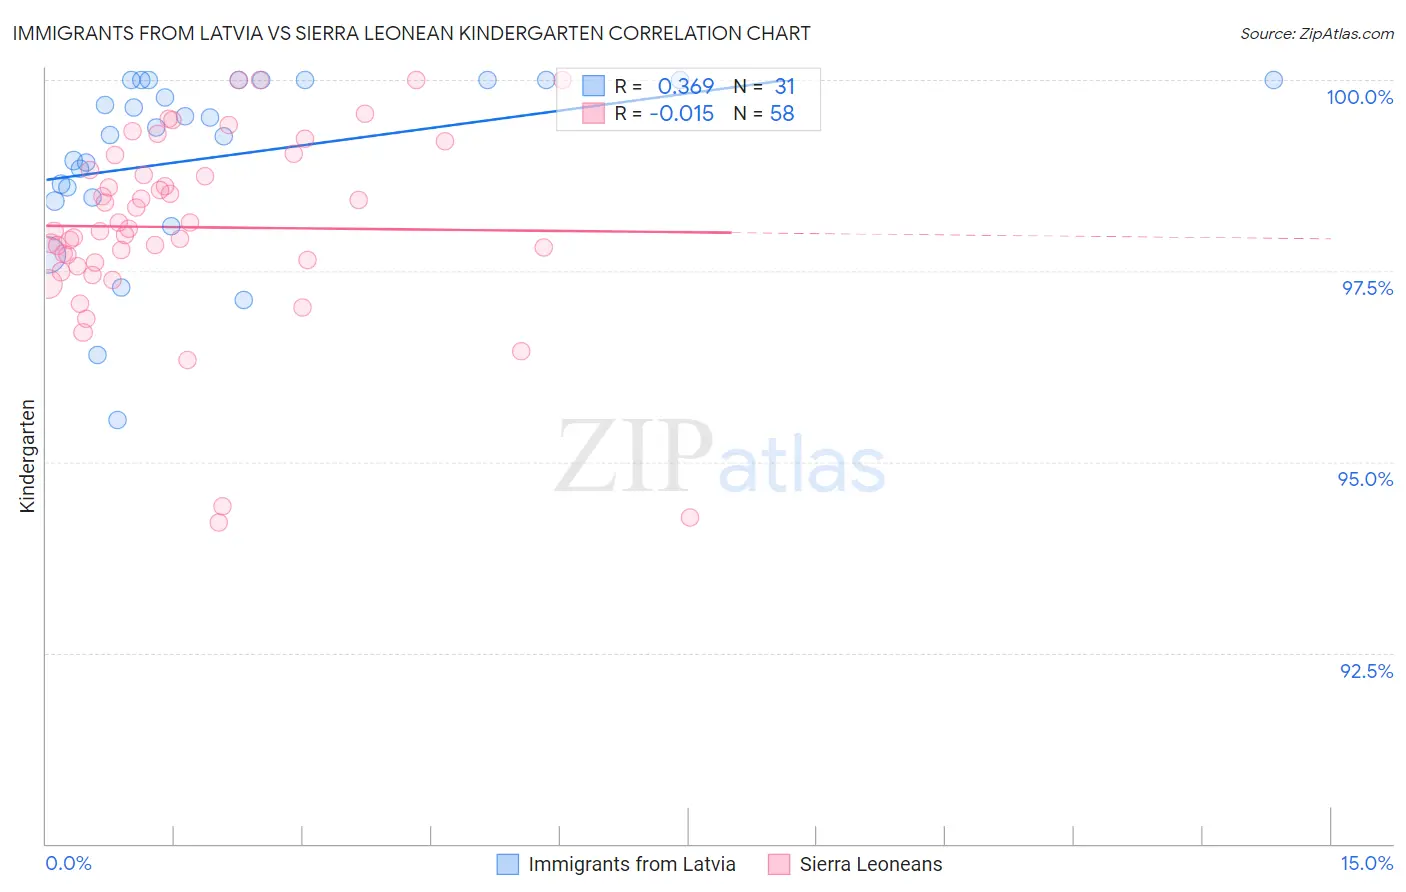
Immigrants from Latvia vs Sierra Leonean Kindergarten Correlation Chart
The statistical analysis conducted on geographies consisting of 113,735,345 people shows a mild positive correlation between the proportion of Immigrants from Latvia and percentage of population with at least kindergarten education in the United States with a correlation coefficient (R) of 0.369 and weighted average of 98.2%. Similarly, the statistical analysis conducted on geographies consisting of 83,337,655 people shows no correlation between the proportion of Sierra Leoneans and percentage of population with at least kindergarten education in the United States with a correlation coefficient (R) of -0.015 and weighted average of 97.7%, a difference of 0.51%.
Kindergarten Correlation Summary
| Measurement | Immigrants from Latvia | Sierra Leonean |
| Minimum | 95.5% | 94.2% |
| Maximum | 100.0% | 100.0% |
| Range | 4.5% | 5.8% |
| Mean | 99.0% | 98.1% |
| Median | 99.4% | 98.0% |
| Interquartile 25% (IQ1) | 98.5% | 97.6% |
| Interquartile 75% (IQ3) | 100.0% | 98.8% |
| Interquartile Range (IQR) | 1.5% | 1.2% |
| Standard Deviation (Sample) | 1.2% | 1.3% |
| Standard Deviation (Population) | 1.1% | 1.2% |
Similar Demographics by Kindergarten
Demographics Similar to Immigrants from Latvia by Kindergarten
In terms of kindergarten, the demographic groups most similar to Immigrants from Latvia are Ute (98.2%, a difference of 0.0%), Iranian (98.2%, a difference of 0.0%), Immigrants from Singapore (98.2%, a difference of 0.010%), Immigrants from Norway (98.2%, a difference of 0.010%), and Immigrants from Czechoslovakia (98.2%, a difference of 0.010%).
| Demographics | Rating | Rank | Kindergarten |
| Basques | 97.3 /100 | #106 | Exceptional 98.2% |
| Turks | 97.3 /100 | #107 | Exceptional 98.2% |
| Immigrants | Switzerland | 97.2 /100 | #108 | Exceptional 98.2% |
| German Russians | 97.1 /100 | #109 | Exceptional 98.2% |
| Immigrants | Singapore | 96.8 /100 | #110 | Exceptional 98.2% |
| Immigrants | Norway | 96.6 /100 | #111 | Exceptional 98.2% |
| Immigrants | Czechoslovakia | 96.6 /100 | #112 | Exceptional 98.2% |
| Immigrants | Latvia | 96.3 /100 | #113 | Exceptional 98.2% |
| Ute | 96.3 /100 | #114 | Exceptional 98.2% |
| Iranians | 96.2 /100 | #115 | Exceptional 98.2% |
| Spanish | 95.8 /100 | #116 | Exceptional 98.2% |
| Immigrants | France | 95.5 /100 | #117 | Exceptional 98.2% |
| Yugoslavians | 95.5 /100 | #118 | Exceptional 98.2% |
| Thais | 94.8 /100 | #119 | Exceptional 98.2% |
| Okinawans | 94.4 /100 | #120 | Exceptional 98.2% |
Demographics Similar to Sierra Leoneans by Kindergarten
In terms of kindergarten, the demographic groups most similar to Sierra Leoneans are Subsaharan African (97.7%, a difference of 0.0%), Senegalese (97.7%, a difference of 0.0%), Iraqi (97.7%, a difference of 0.010%), Immigrants from Nepal (97.7%, a difference of 0.010%), and Sudanese (97.7%, a difference of 0.010%).
| Demographics | Rating | Rank | Kindergarten |
| Immigrants | Sudan | 4.5 /100 | #222 | Tragic 97.7% |
| Immigrants | Syria | 4.3 /100 | #223 | Tragic 97.7% |
| Iraqis | 3.9 /100 | #224 | Tragic 97.7% |
| Immigrants | Nepal | 3.8 /100 | #225 | Tragic 97.7% |
| Sudanese | 3.7 /100 | #226 | Tragic 97.7% |
| Immigrants | Costa Rica | 3.6 /100 | #227 | Tragic 97.7% |
| Sub-Saharan Africans | 3.5 /100 | #228 | Tragic 97.7% |
| Sierra Leoneans | 3.4 /100 | #229 | Tragic 97.7% |
| Senegalese | 3.3 /100 | #230 | Tragic 97.7% |
| Puerto Ricans | 2.7 /100 | #231 | Tragic 97.7% |
| Immigrants | Uruguay | 2.6 /100 | #232 | Tragic 97.7% |
| Immigrants | Pakistan | 2.2 /100 | #233 | Tragic 97.7% |
| Immigrants | Malaysia | 2.2 /100 | #234 | Tragic 97.7% |
| Colombians | 2.2 /100 | #235 | Tragic 97.7% |
| Immigrants | Western Asia | 2.1 /100 | #236 | Tragic 97.7% |