Immigrants from Latvia vs Immigrants from Bangladesh Kindergarten
COMPARE
Immigrants from Latvia
Immigrants from Bangladesh
Kindergarten
Kindergarten Comparison
Immigrants from Latvia
Immigrants from Bangladesh
98.2%
KINDERGARTEN
96.3/ 100
METRIC RATING
113th/ 347
METRIC RANK
96.8%
KINDERGARTEN
0.0/ 100
METRIC RATING
321st/ 347
METRIC RANK
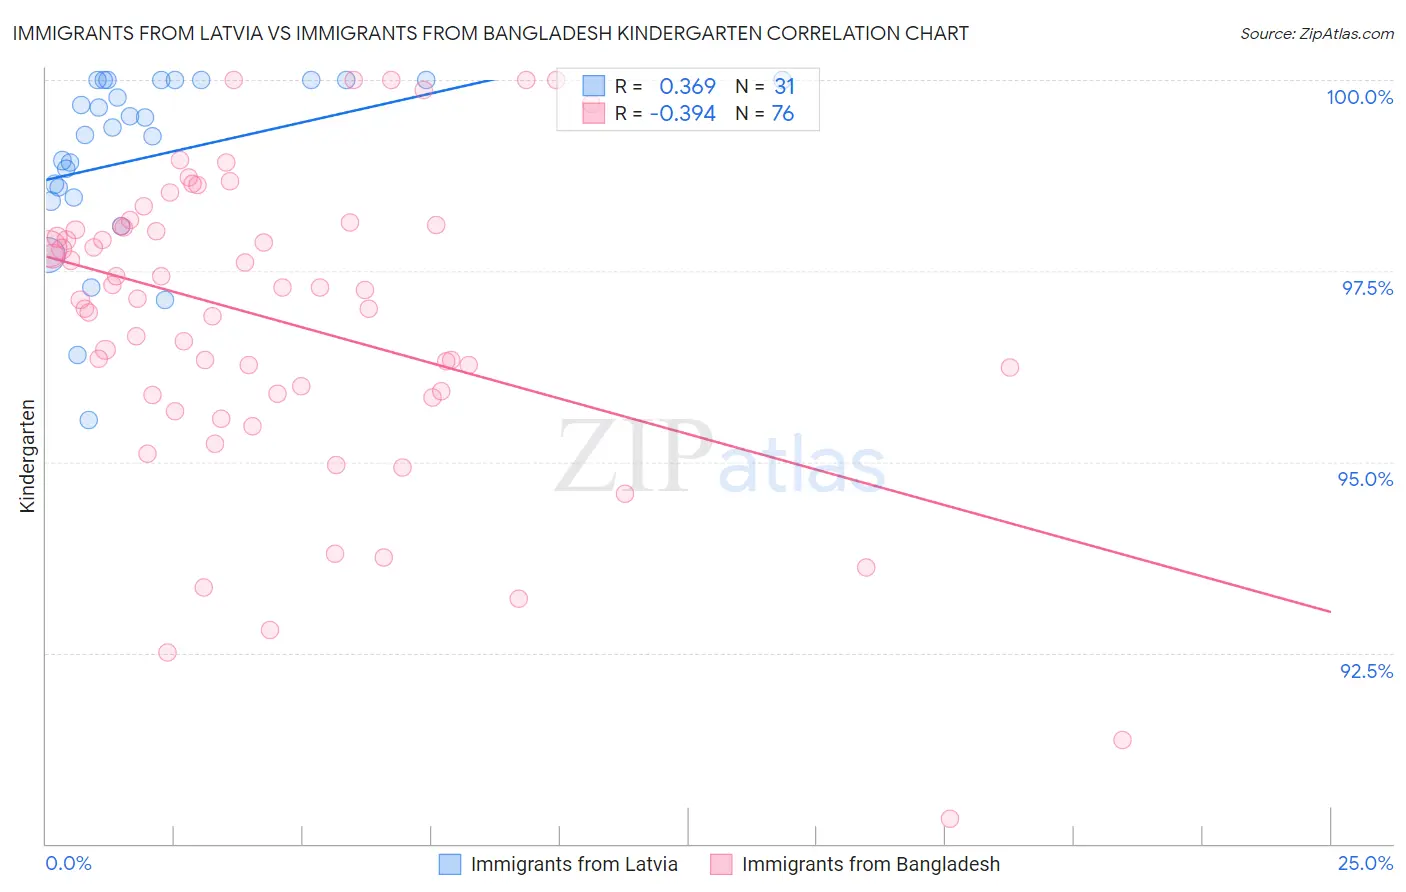
Immigrants from Latvia vs Immigrants from Bangladesh Kindergarten Correlation Chart
The statistical analysis conducted on geographies consisting of 113,735,345 people shows a mild positive correlation between the proportion of Immigrants from Latvia and percentage of population with at least kindergarten education in the United States with a correlation coefficient (R) of 0.369 and weighted average of 98.2%. Similarly, the statistical analysis conducted on geographies consisting of 203,681,254 people shows a mild negative correlation between the proportion of Immigrants from Bangladesh and percentage of population with at least kindergarten education in the United States with a correlation coefficient (R) of -0.394 and weighted average of 96.8%, a difference of 1.4%.
Kindergarten Correlation Summary
| Measurement | Immigrants from Latvia | Immigrants from Bangladesh |
| Minimum | 95.5% | 90.3% |
| Maximum | 100.0% | 100.0% |
| Range | 4.5% | 9.7% |
| Mean | 99.0% | 96.8% |
| Median | 99.4% | 97.2% |
| Interquartile 25% (IQ1) | 98.5% | 95.9% |
| Interquartile 75% (IQ3) | 100.0% | 98.1% |
| Interquartile Range (IQR) | 1.5% | 2.2% |
| Standard Deviation (Sample) | 1.2% | 2.0% |
| Standard Deviation (Population) | 1.1% | 2.0% |
Similar Demographics by Kindergarten
Demographics Similar to Immigrants from Latvia by Kindergarten
In terms of kindergarten, the demographic groups most similar to Immigrants from Latvia are Ute (98.2%, a difference of 0.0%), Iranian (98.2%, a difference of 0.0%), Immigrants from Singapore (98.2%, a difference of 0.010%), Immigrants from Norway (98.2%, a difference of 0.010%), and Immigrants from Czechoslovakia (98.2%, a difference of 0.010%).
| Demographics | Rating | Rank | Kindergarten |
| Basques | 97.3 /100 | #106 | Exceptional 98.2% |
| Turks | 97.3 /100 | #107 | Exceptional 98.2% |
| Immigrants | Switzerland | 97.2 /100 | #108 | Exceptional 98.2% |
| German Russians | 97.1 /100 | #109 | Exceptional 98.2% |
| Immigrants | Singapore | 96.8 /100 | #110 | Exceptional 98.2% |
| Immigrants | Norway | 96.6 /100 | #111 | Exceptional 98.2% |
| Immigrants | Czechoslovakia | 96.6 /100 | #112 | Exceptional 98.2% |
| Immigrants | Latvia | 96.3 /100 | #113 | Exceptional 98.2% |
| Ute | 96.3 /100 | #114 | Exceptional 98.2% |
| Iranians | 96.2 /100 | #115 | Exceptional 98.2% |
| Spanish | 95.8 /100 | #116 | Exceptional 98.2% |
| Immigrants | France | 95.5 /100 | #117 | Exceptional 98.2% |
| Yugoslavians | 95.5 /100 | #118 | Exceptional 98.2% |
| Thais | 94.8 /100 | #119 | Exceptional 98.2% |
| Okinawans | 94.4 /100 | #120 | Exceptional 98.2% |
Demographics Similar to Immigrants from Bangladesh by Kindergarten
In terms of kindergarten, the demographic groups most similar to Immigrants from Bangladesh are Immigrants from Guyana (96.8%, a difference of 0.010%), Immigrants from Burma/Myanmar (96.8%, a difference of 0.010%), Mexican American Indian (96.8%, a difference of 0.010%), Immigrants from Laos (96.9%, a difference of 0.020%), and Immigrants from Honduras (96.8%, a difference of 0.020%).
| Demographics | Rating | Rank | Kindergarten |
| Hondurans | 0.0 /100 | #314 | Tragic 96.9% |
| Immigrants | Belize | 0.0 /100 | #315 | Tragic 96.9% |
| Immigrants | Nicaragua | 0.0 /100 | #316 | Tragic 96.9% |
| Immigrants | Ecuador | 0.0 /100 | #317 | Tragic 96.9% |
| Immigrants | Laos | 0.0 /100 | #318 | Tragic 96.9% |
| Immigrants | Guyana | 0.0 /100 | #319 | Tragic 96.8% |
| Immigrants | Burma/Myanmar | 0.0 /100 | #320 | Tragic 96.8% |
| Immigrants | Bangladesh | 0.0 /100 | #321 | Tragic 96.8% |
| Mexican American Indians | 0.0 /100 | #322 | Tragic 96.8% |
| Immigrants | Honduras | 0.0 /100 | #323 | Tragic 96.8% |
| Vietnamese | 0.0 /100 | #324 | Tragic 96.8% |
| Indonesians | 0.0 /100 | #325 | Tragic 96.8% |
| Dominicans | 0.0 /100 | #326 | Tragic 96.8% |
| Mexicans | 0.0 /100 | #327 | Tragic 96.7% |
| Immigrants | Latin America | 0.0 /100 | #328 | Tragic 96.7% |