Immigrants from Kuwait vs American Vision Disability
COMPARE
Immigrants from Kuwait
American
Vision Disability
Vision Disability Comparison
Immigrants from Kuwait
Americans
2.0%
VISION DISABILITY
99.8/ 100
METRIC RATING
38th/ 347
METRIC RANK
2.6%
VISION DISABILITY
0.0/ 100
METRIC RATING
312th/ 347
METRIC RANK
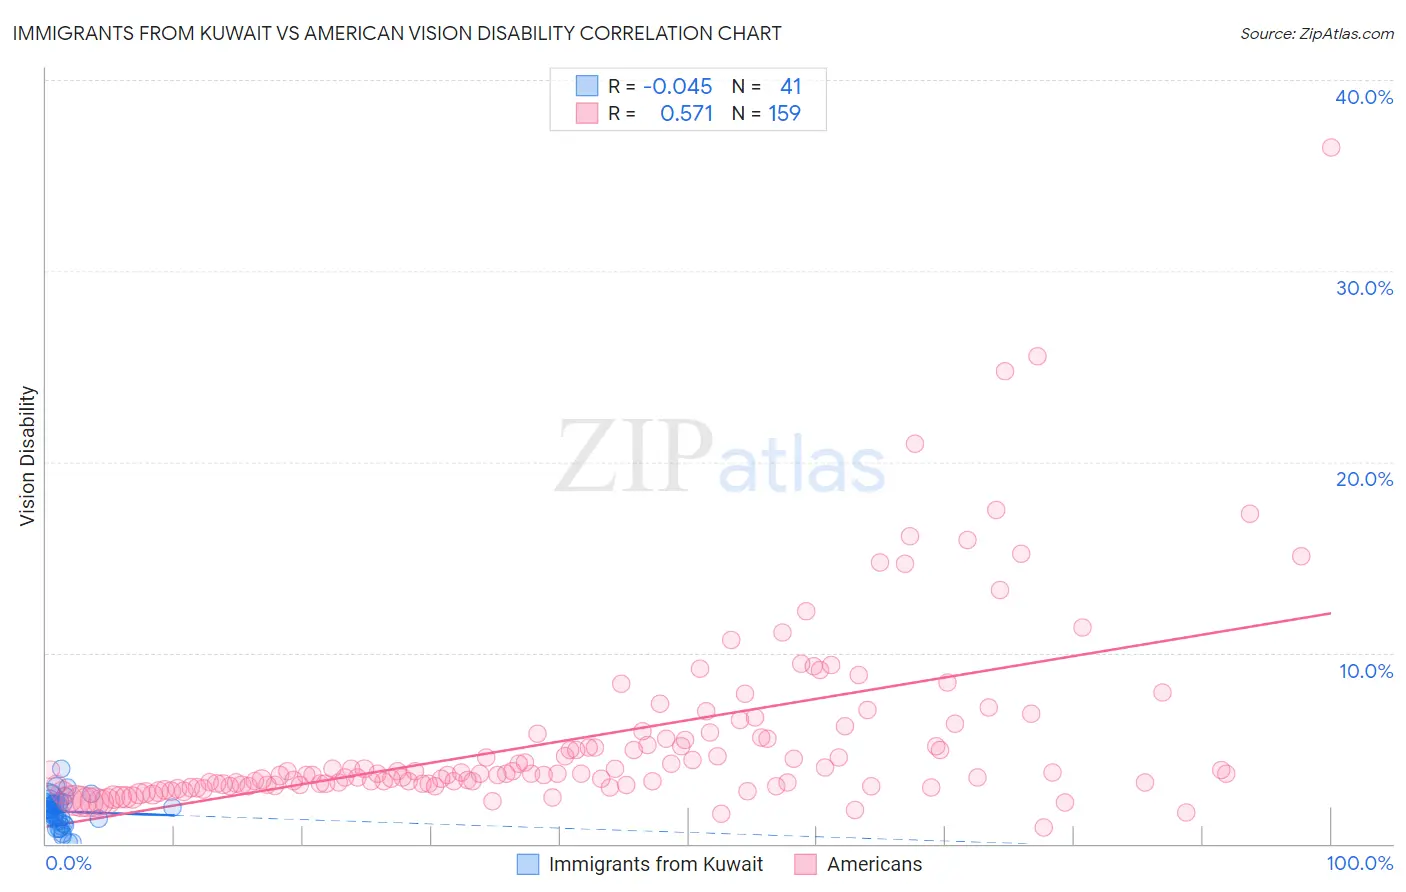
Immigrants from Kuwait vs American Vision Disability Correlation Chart
The statistical analysis conducted on geographies consisting of 136,909,771 people shows no correlation between the proportion of Immigrants from Kuwait and percentage of population with vision disability in the United States with a correlation coefficient (R) of -0.045 and weighted average of 2.0%. Similarly, the statistical analysis conducted on geographies consisting of 579,371,310 people shows a substantial positive correlation between the proportion of Americans and percentage of population with vision disability in the United States with a correlation coefficient (R) of 0.571 and weighted average of 2.6%, a difference of 35.0%.
Vision Disability Correlation Summary
| Measurement | Immigrants from Kuwait | American |
| Minimum | 0.068% | 0.84% |
| Maximum | 3.9% | 36.4% |
| Range | 3.9% | 35.6% |
| Mean | 1.7% | 5.5% |
| Median | 1.8% | 3.7% |
| Interquartile 25% (IQ1) | 1.1% | 3.1% |
| Interquartile 75% (IQ3) | 2.1% | 5.6% |
| Interquartile Range (IQR) | 1.0% | 2.5% |
| Standard Deviation (Sample) | 0.81% | 4.9% |
| Standard Deviation (Population) | 0.80% | 4.9% |
Similar Demographics by Vision Disability
Demographics Similar to Immigrants from Kuwait by Vision Disability
In terms of vision disability, the demographic groups most similar to Immigrants from Kuwait are Bhutanese (2.0%, a difference of 0.040%), Zimbabwean (2.0%, a difference of 0.060%), Immigrants from Ireland (2.0%, a difference of 0.26%), Cypriot (2.0%, a difference of 0.28%), and Cambodian (2.0%, a difference of 0.29%).
| Demographics | Rating | Rank | Vision Disability |
| Mongolians | 99.9 /100 | #31 | Exceptional 1.9% |
| Luxembourgers | 99.9 /100 | #32 | Exceptional 1.9% |
| Immigrants | Egypt | 99.9 /100 | #33 | Exceptional 1.9% |
| Immigrants | Turkey | 99.8 /100 | #34 | Exceptional 1.9% |
| Immigrants | Australia | 99.8 /100 | #35 | Exceptional 1.9% |
| Cambodians | 99.8 /100 | #36 | Exceptional 2.0% |
| Bhutanese | 99.8 /100 | #37 | Exceptional 2.0% |
| Immigrants | Kuwait | 99.8 /100 | #38 | Exceptional 2.0% |
| Zimbabweans | 99.7 /100 | #39 | Exceptional 2.0% |
| Immigrants | Ireland | 99.7 /100 | #40 | Exceptional 2.0% |
| Cypriots | 99.7 /100 | #41 | Exceptional 2.0% |
| Immigrants | Ethiopia | 99.7 /100 | #42 | Exceptional 2.0% |
| Eastern Europeans | 99.7 /100 | #43 | Exceptional 2.0% |
| Immigrants | Indonesia | 99.7 /100 | #44 | Exceptional 2.0% |
| Ethiopians | 99.7 /100 | #45 | Exceptional 2.0% |
Demographics Similar to Americans by Vision Disability
In terms of vision disability, the demographic groups most similar to Americans are Potawatomi (2.6%, a difference of 0.010%), Inupiat (2.7%, a difference of 0.080%), Dominican (2.6%, a difference of 0.83%), Blackfeet (2.6%, a difference of 0.87%), and Immigrants from Yemen (2.6%, a difference of 1.2%).
| Demographics | Rating | Rank | Vision Disability |
| Hispanics or Latinos | 0.0 /100 | #305 | Tragic 2.6% |
| Iroquois | 0.0 /100 | #306 | Tragic 2.6% |
| Immigrants | Dominican Republic | 0.0 /100 | #307 | Tragic 2.6% |
| Arapaho | 0.0 /100 | #308 | Tragic 2.6% |
| Immigrants | Yemen | 0.0 /100 | #309 | Tragic 2.6% |
| Blackfeet | 0.0 /100 | #310 | Tragic 2.6% |
| Dominicans | 0.0 /100 | #311 | Tragic 2.6% |
| Americans | 0.0 /100 | #312 | Tragic 2.6% |
| Potawatomi | 0.0 /100 | #313 | Tragic 2.6% |
| Inupiat | 0.0 /100 | #314 | Tragic 2.7% |
| Osage | 0.0 /100 | #315 | Tragic 2.7% |
| Shoshone | 0.0 /100 | #316 | Tragic 2.7% |
| Yup'ik | 0.0 /100 | #317 | Tragic 2.7% |
| Alaska Natives | 0.0 /100 | #318 | Tragic 2.7% |
| Tohono O'odham | 0.0 /100 | #319 | Tragic 2.8% |