Immigrants from Korea vs Blackfeet Master's Degree
COMPARE
Immigrants from Korea
Blackfeet
Master's Degree
Master's Degree Comparison
Immigrants from Korea
Blackfeet
19.7%
MASTER'S DEGREE
100.0/ 100
METRIC RATING
31st/ 347
METRIC RANK
12.1%
MASTER'S DEGREE
0.3/ 100
METRIC RATING
273rd/ 347
METRIC RANK
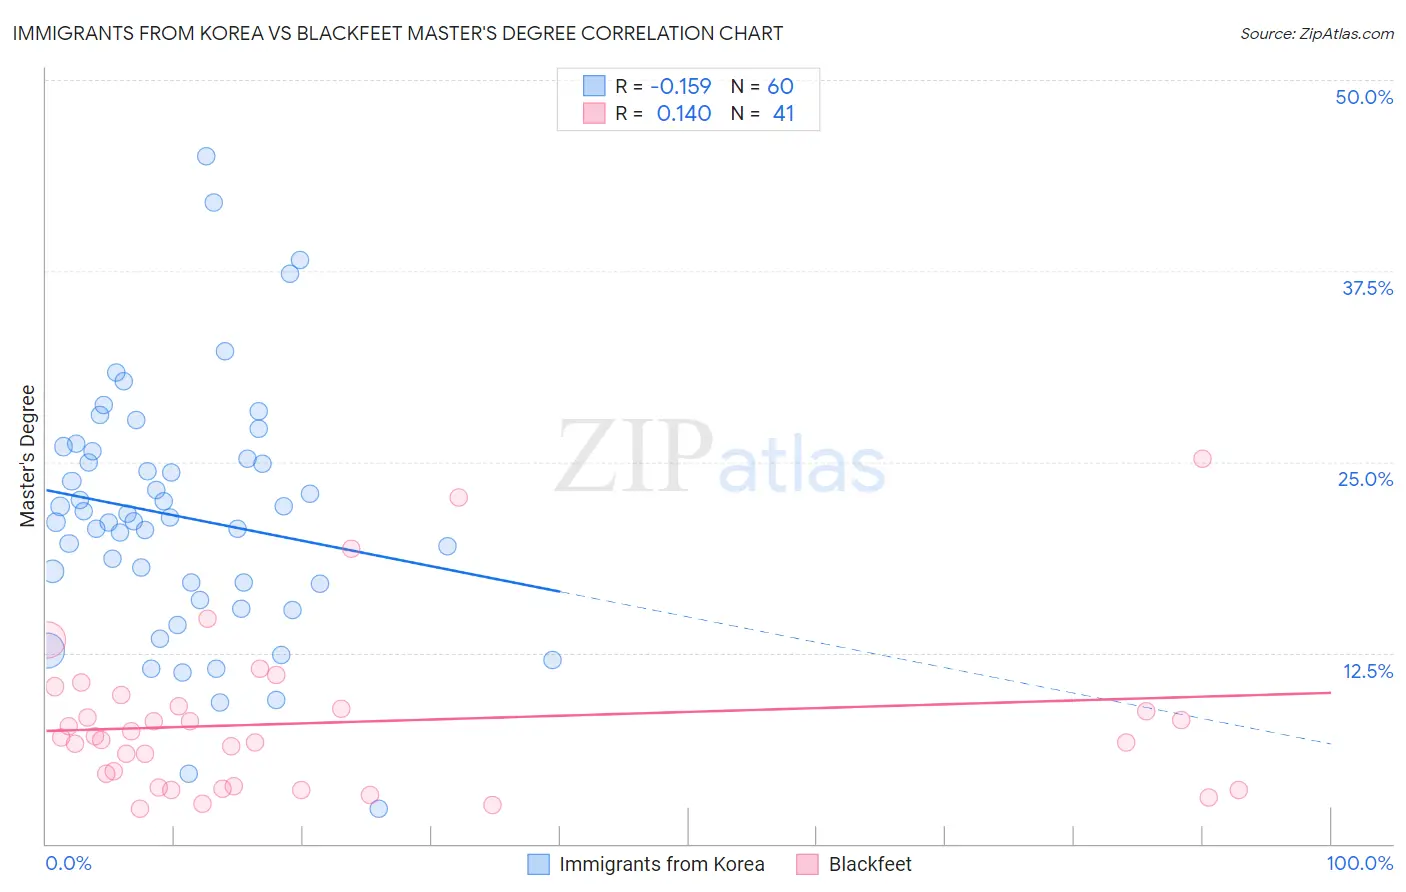
Immigrants from Korea vs Blackfeet Master's Degree Correlation Chart
The statistical analysis conducted on geographies consisting of 416,166,460 people shows a poor negative correlation between the proportion of Immigrants from Korea and percentage of population with at least master's degree education in the United States with a correlation coefficient (R) of -0.159 and weighted average of 19.7%. Similarly, the statistical analysis conducted on geographies consisting of 309,479,249 people shows a poor positive correlation between the proportion of Blackfeet and percentage of population with at least master's degree education in the United States with a correlation coefficient (R) of 0.140 and weighted average of 12.1%, a difference of 63.1%.
Master's Degree Correlation Summary
| Measurement | Immigrants from Korea | Blackfeet |
| Minimum | 2.3% | 2.3% |
| Maximum | 45.0% | 25.2% |
| Range | 42.7% | 22.9% |
| Mean | 21.4% | 7.9% |
| Median | 21.2% | 7.0% |
| Interquartile 25% (IQ1) | 16.5% | 3.7% |
| Interquartile 75% (IQ3) | 25.4% | 9.3% |
| Interquartile Range (IQR) | 9.0% | 5.6% |
| Standard Deviation (Sample) | 8.2% | 5.1% |
| Standard Deviation (Population) | 8.1% | 5.1% |
Similar Demographics by Master's Degree
Demographics Similar to Immigrants from Korea by Master's Degree
In terms of master's degree, the demographic groups most similar to Immigrants from Korea are Immigrants from Turkey (19.7%, a difference of 0.010%), Burmese (19.7%, a difference of 0.070%), Latvian (19.8%, a difference of 0.52%), Russian (19.5%, a difference of 0.85%), and Immigrants from Denmark (19.5%, a difference of 0.88%).
| Demographics | Rating | Rank | Master's Degree |
| Immigrants | Sweden | 100.0 /100 | #24 | Exceptional 20.3% |
| Immigrants | Japan | 100.0 /100 | #25 | Exceptional 20.0% |
| Cambodians | 100.0 /100 | #26 | Exceptional 20.0% |
| Immigrants | Sri Lanka | 100.0 /100 | #27 | Exceptional 19.9% |
| Turks | 100.0 /100 | #28 | Exceptional 19.9% |
| Latvians | 100.0 /100 | #29 | Exceptional 19.8% |
| Immigrants | Turkey | 100.0 /100 | #30 | Exceptional 19.7% |
| Immigrants | Korea | 100.0 /100 | #31 | Exceptional 19.7% |
| Burmese | 100.0 /100 | #32 | Exceptional 19.7% |
| Russians | 100.0 /100 | #33 | Exceptional 19.5% |
| Immigrants | Denmark | 100.0 /100 | #34 | Exceptional 19.5% |
| Immigrants | Northern Europe | 100.0 /100 | #35 | Exceptional 19.5% |
| Immigrants | Russia | 100.0 /100 | #36 | Exceptional 19.4% |
| Mongolians | 100.0 /100 | #37 | Exceptional 19.4% |
| Bolivians | 100.0 /100 | #38 | Exceptional 19.3% |
Demographics Similar to Blackfeet by Master's Degree
In terms of master's degree, the demographic groups most similar to Blackfeet are Comanche (12.1%, a difference of 0.090%), Cape Verdean (12.1%, a difference of 0.090%), Cuban (12.1%, a difference of 0.10%), Haitian (12.1%, a difference of 0.15%), and Black/African American (12.1%, a difference of 0.16%).
| Demographics | Rating | Rank | Master's Degree |
| Bahamians | 0.5 /100 | #266 | Tragic 12.4% |
| Americans | 0.4 /100 | #267 | Tragic 12.3% |
| Native Hawaiians | 0.4 /100 | #268 | Tragic 12.3% |
| Central Americans | 0.3 /100 | #269 | Tragic 12.2% |
| Salvadorans | 0.3 /100 | #270 | Tragic 12.2% |
| Haitians | 0.3 /100 | #271 | Tragic 12.1% |
| Comanche | 0.3 /100 | #272 | Tragic 12.1% |
| Blackfeet | 0.3 /100 | #273 | Tragic 12.1% |
| Cape Verdeans | 0.3 /100 | #274 | Tragic 12.1% |
| Cubans | 0.3 /100 | #275 | Tragic 12.1% |
| Blacks/African Americans | 0.3 /100 | #276 | Tragic 12.1% |
| Immigrants | Caribbean | 0.3 /100 | #277 | Tragic 12.1% |
| Potawatomi | 0.3 /100 | #278 | Tragic 12.1% |
| Immigrants | Belize | 0.2 /100 | #279 | Tragic 12.1% |
| Immigrants | Dominican Republic | 0.2 /100 | #280 | Tragic 12.1% |