Immigrants from Korea vs Immigrants Master's Degree
COMPARE
Immigrants from Korea
Immigrants
Master's Degree
Master's Degree Comparison
Immigrants from Korea
Immigrants
19.7%
MASTER'S DEGREE
100.0/ 100
METRIC RATING
31st/ 347
METRIC RANK
14.6%
MASTER'S DEGREE
36.0/ 100
METRIC RATING
189th/ 347
METRIC RANK
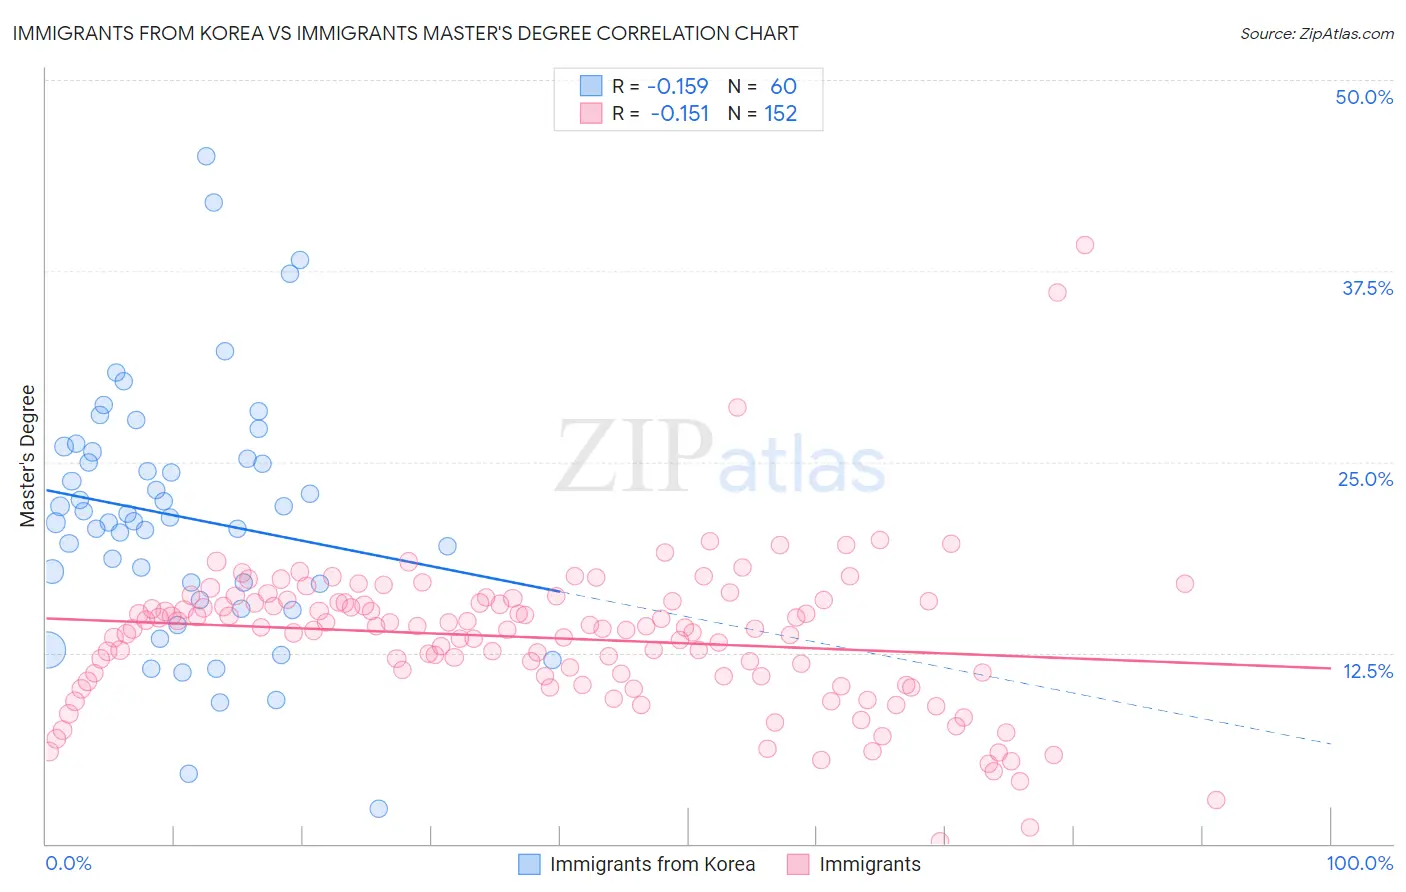
Immigrants from Korea vs Immigrants Master's Degree Correlation Chart
The statistical analysis conducted on geographies consisting of 416,166,460 people shows a poor negative correlation between the proportion of Immigrants from Korea and percentage of population with at least master's degree education in the United States with a correlation coefficient (R) of -0.159 and weighted average of 19.7%. Similarly, the statistical analysis conducted on geographies consisting of 576,625,000 people shows a poor negative correlation between the proportion of Immigrants and percentage of population with at least master's degree education in the United States with a correlation coefficient (R) of -0.151 and weighted average of 14.6%, a difference of 34.6%.
Master's Degree Correlation Summary
| Measurement | Immigrants from Korea | Immigrants |
| Minimum | 2.3% | 0.15% |
| Maximum | 45.0% | 39.2% |
| Range | 42.7% | 39.0% |
| Mean | 21.4% | 13.5% |
| Median | 21.2% | 14.1% |
| Interquartile 25% (IQ1) | 16.5% | 11.0% |
| Interquartile 75% (IQ3) | 25.4% | 15.8% |
| Interquartile Range (IQR) | 9.0% | 4.9% |
| Standard Deviation (Sample) | 8.2% | 5.0% |
| Standard Deviation (Population) | 8.1% | 5.0% |
Similar Demographics by Master's Degree
Demographics Similar to Immigrants from Korea by Master's Degree
In terms of master's degree, the demographic groups most similar to Immigrants from Korea are Immigrants from Turkey (19.7%, a difference of 0.010%), Burmese (19.7%, a difference of 0.070%), Latvian (19.8%, a difference of 0.52%), Russian (19.5%, a difference of 0.85%), and Immigrants from Denmark (19.5%, a difference of 0.88%).
| Demographics | Rating | Rank | Master's Degree |
| Immigrants | Sweden | 100.0 /100 | #24 | Exceptional 20.3% |
| Immigrants | Japan | 100.0 /100 | #25 | Exceptional 20.0% |
| Cambodians | 100.0 /100 | #26 | Exceptional 20.0% |
| Immigrants | Sri Lanka | 100.0 /100 | #27 | Exceptional 19.9% |
| Turks | 100.0 /100 | #28 | Exceptional 19.9% |
| Latvians | 100.0 /100 | #29 | Exceptional 19.8% |
| Immigrants | Turkey | 100.0 /100 | #30 | Exceptional 19.7% |
| Immigrants | Korea | 100.0 /100 | #31 | Exceptional 19.7% |
| Burmese | 100.0 /100 | #32 | Exceptional 19.7% |
| Russians | 100.0 /100 | #33 | Exceptional 19.5% |
| Immigrants | Denmark | 100.0 /100 | #34 | Exceptional 19.5% |
| Immigrants | Northern Europe | 100.0 /100 | #35 | Exceptional 19.5% |
| Immigrants | Russia | 100.0 /100 | #36 | Exceptional 19.4% |
| Mongolians | 100.0 /100 | #37 | Exceptional 19.4% |
| Bolivians | 100.0 /100 | #38 | Exceptional 19.3% |
Demographics Similar to Immigrants by Master's Degree
In terms of master's degree, the demographic groups most similar to Immigrants are Spaniard (14.6%, a difference of 0.020%), Immigrants from Costa Rica (14.7%, a difference of 0.040%), Basque (14.7%, a difference of 0.080%), Immigrants from Oceania (14.7%, a difference of 0.16%), and Welsh (14.6%, a difference of 0.25%).
| Demographics | Rating | Rank | Master's Degree |
| Czechs | 40.4 /100 | #182 | Average 14.7% |
| Sri Lankans | 39.6 /100 | #183 | Fair 14.7% |
| Immigrants | Zaire | 39.5 /100 | #184 | Fair 14.7% |
| Barbadians | 38.3 /100 | #185 | Fair 14.7% |
| Immigrants | Oceania | 37.1 /100 | #186 | Fair 14.7% |
| Basques | 36.5 /100 | #187 | Fair 14.7% |
| Immigrants | Costa Rica | 36.2 /100 | #188 | Fair 14.7% |
| Immigrants | Immigrants | 36.0 /100 | #189 | Fair 14.6% |
| Spaniards | 35.8 /100 | #190 | Fair 14.6% |
| Welsh | 34.2 /100 | #191 | Fair 14.6% |
| Immigrants | Middle Africa | 33.6 /100 | #192 | Fair 14.6% |
| Immigrants | Nigeria | 32.7 /100 | #193 | Fair 14.6% |
| Chinese | 32.5 /100 | #194 | Fair 14.6% |
| Danes | 31.3 /100 | #195 | Fair 14.5% |
| Czechoslovakians | 29.9 /100 | #196 | Fair 14.5% |