Immigrants from Korea vs Greek Master's Degree
COMPARE
Immigrants from Korea
Greek
Master's Degree
Master's Degree Comparison
Immigrants from Korea
Greeks
19.7%
MASTER'S DEGREE
100.0/ 100
METRIC RATING
31st/ 347
METRIC RANK
17.5%
MASTER'S DEGREE
99.5/ 100
METRIC RATING
82nd/ 347
METRIC RANK
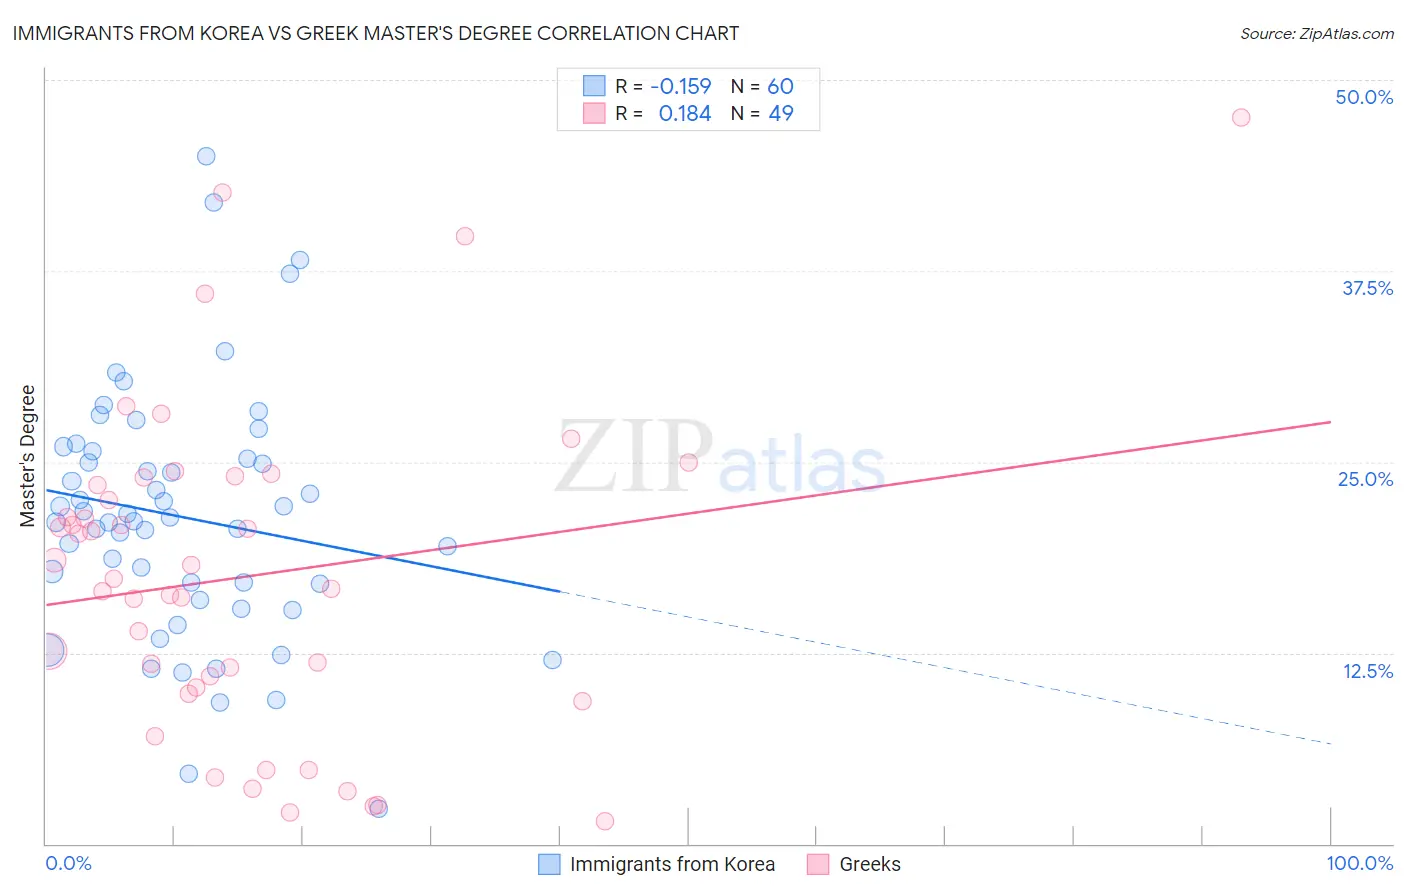
Immigrants from Korea vs Greek Master's Degree Correlation Chart
The statistical analysis conducted on geographies consisting of 416,166,460 people shows a poor negative correlation between the proportion of Immigrants from Korea and percentage of population with at least master's degree education in the United States with a correlation coefficient (R) of -0.159 and weighted average of 19.7%. Similarly, the statistical analysis conducted on geographies consisting of 482,528,653 people shows a poor positive correlation between the proportion of Greeks and percentage of population with at least master's degree education in the United States with a correlation coefficient (R) of 0.184 and weighted average of 17.5%, a difference of 13.0%.
Master's Degree Correlation Summary
| Measurement | Immigrants from Korea | Greek |
| Minimum | 2.3% | 1.5% |
| Maximum | 45.0% | 47.6% |
| Range | 42.7% | 46.1% |
| Mean | 21.4% | 17.5% |
| Median | 21.2% | 17.3% |
| Interquartile 25% (IQ1) | 16.5% | 10.0% |
| Interquartile 75% (IQ3) | 25.4% | 23.7% |
| Interquartile Range (IQR) | 9.0% | 13.7% |
| Standard Deviation (Sample) | 8.2% | 10.6% |
| Standard Deviation (Population) | 8.1% | 10.5% |
Similar Demographics by Master's Degree
Demographics Similar to Immigrants from Korea by Master's Degree
In terms of master's degree, the demographic groups most similar to Immigrants from Korea are Immigrants from Turkey (19.7%, a difference of 0.010%), Burmese (19.7%, a difference of 0.070%), Latvian (19.8%, a difference of 0.52%), Russian (19.5%, a difference of 0.85%), and Immigrants from Denmark (19.5%, a difference of 0.88%).
| Demographics | Rating | Rank | Master's Degree |
| Immigrants | Sweden | 100.0 /100 | #24 | Exceptional 20.3% |
| Immigrants | Japan | 100.0 /100 | #25 | Exceptional 20.0% |
| Cambodians | 100.0 /100 | #26 | Exceptional 20.0% |
| Immigrants | Sri Lanka | 100.0 /100 | #27 | Exceptional 19.9% |
| Turks | 100.0 /100 | #28 | Exceptional 19.9% |
| Latvians | 100.0 /100 | #29 | Exceptional 19.8% |
| Immigrants | Turkey | 100.0 /100 | #30 | Exceptional 19.7% |
| Immigrants | Korea | 100.0 /100 | #31 | Exceptional 19.7% |
| Burmese | 100.0 /100 | #32 | Exceptional 19.7% |
| Russians | 100.0 /100 | #33 | Exceptional 19.5% |
| Immigrants | Denmark | 100.0 /100 | #34 | Exceptional 19.5% |
| Immigrants | Northern Europe | 100.0 /100 | #35 | Exceptional 19.5% |
| Immigrants | Russia | 100.0 /100 | #36 | Exceptional 19.4% |
| Mongolians | 100.0 /100 | #37 | Exceptional 19.4% |
| Bolivians | 100.0 /100 | #38 | Exceptional 19.3% |
Demographics Similar to Greeks by Master's Degree
In terms of master's degree, the demographic groups most similar to Greeks are Immigrants from Western Asia (17.5%, a difference of 0.050%), Immigrants from Zimbabwe (17.4%, a difference of 0.050%), Carpatho Rusyn (17.5%, a difference of 0.35%), Immigrants from Scotland (17.4%, a difference of 0.39%), and Immigrants from Lebanon (17.5%, a difference of 0.40%).
| Demographics | Rating | Rank | Master's Degree |
| Egyptians | 99.6 /100 | #75 | Exceptional 17.6% |
| Immigrants | Indonesia | 99.6 /100 | #76 | Exceptional 17.6% |
| Immigrants | Eastern Europe | 99.6 /100 | #77 | Exceptional 17.6% |
| Immigrants | Hungary | 99.6 /100 | #78 | Exceptional 17.5% |
| Immigrants | Lebanon | 99.6 /100 | #79 | Exceptional 17.5% |
| Carpatho Rusyns | 99.6 /100 | #80 | Exceptional 17.5% |
| Immigrants | Western Asia | 99.5 /100 | #81 | Exceptional 17.5% |
| Greeks | 99.5 /100 | #82 | Exceptional 17.5% |
| Immigrants | Zimbabwe | 99.5 /100 | #83 | Exceptional 17.4% |
| Immigrants | Scotland | 99.4 /100 | #84 | Exceptional 17.4% |
| Immigrants | Brazil | 99.4 /100 | #85 | Exceptional 17.4% |
| Immigrants | Croatia | 99.3 /100 | #86 | Exceptional 17.3% |
| Maltese | 99.3 /100 | #87 | Exceptional 17.3% |
| Immigrants | Canada | 99.2 /100 | #88 | Exceptional 17.2% |
| Bhutanese | 99.1 /100 | #89 | Exceptional 17.2% |