Immigrants from Korea vs Immigrants from Bolivia Master's Degree
COMPARE
Immigrants from Korea
Immigrants from Bolivia
Master's Degree
Master's Degree Comparison
Immigrants from Korea
Immigrants from Bolivia
19.7%
MASTER'S DEGREE
100.0/ 100
METRIC RATING
31st/ 347
METRIC RANK
19.1%
MASTER'S DEGREE
100.0/ 100
METRIC RATING
40th/ 347
METRIC RANK
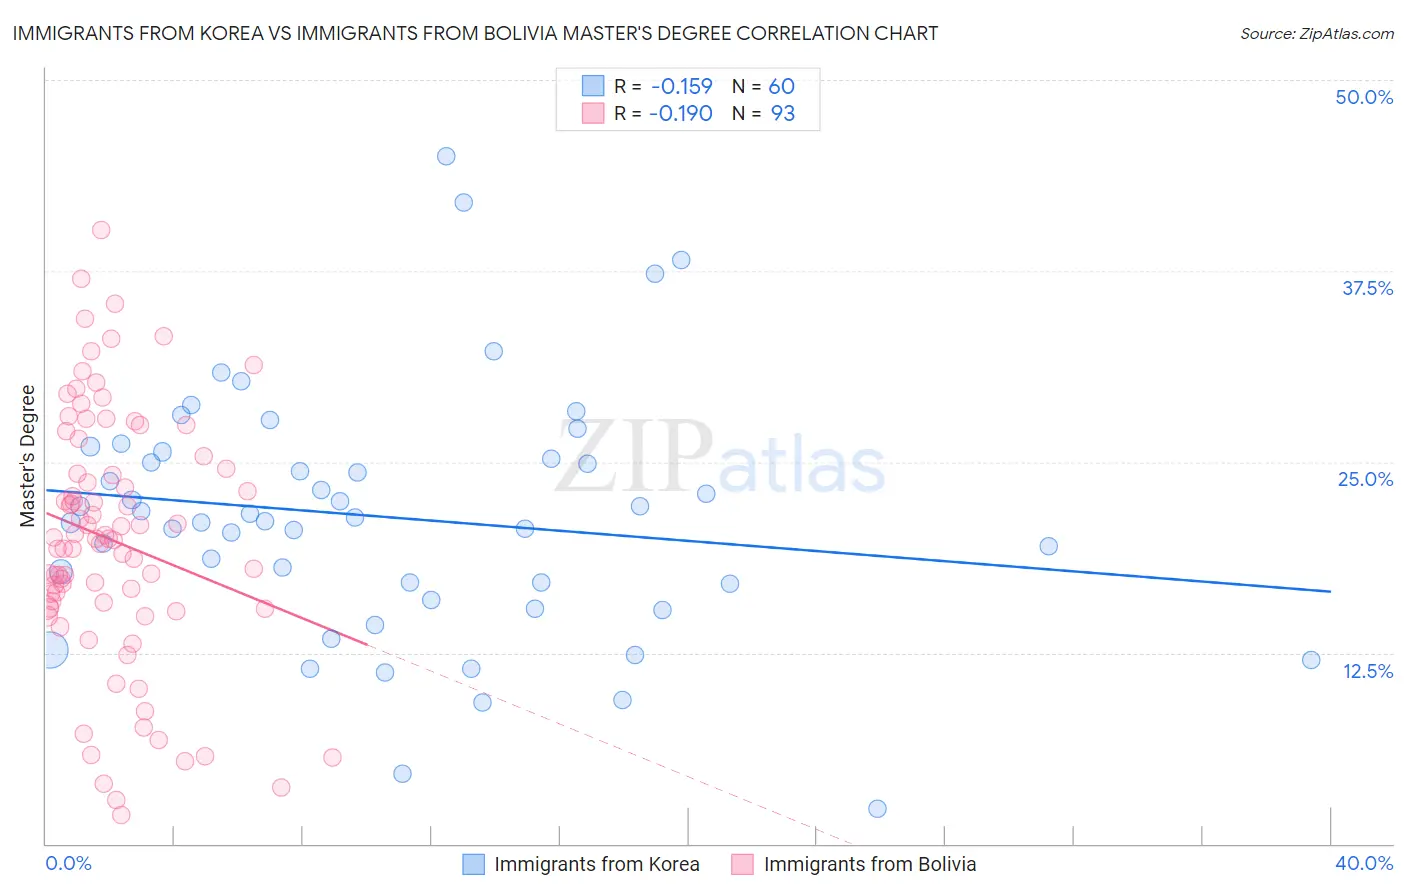
Immigrants from Korea vs Immigrants from Bolivia Master's Degree Correlation Chart
The statistical analysis conducted on geographies consisting of 416,166,460 people shows a poor negative correlation between the proportion of Immigrants from Korea and percentage of population with at least master's degree education in the United States with a correlation coefficient (R) of -0.159 and weighted average of 19.7%. Similarly, the statistical analysis conducted on geographies consisting of 158,724,078 people shows a poor negative correlation between the proportion of Immigrants from Bolivia and percentage of population with at least master's degree education in the United States with a correlation coefficient (R) of -0.190 and weighted average of 19.1%, a difference of 3.1%.
Master's Degree Correlation Summary
| Measurement | Immigrants from Korea | Immigrants from Bolivia |
| Minimum | 2.3% | 1.9% |
| Maximum | 45.0% | 40.2% |
| Range | 42.7% | 38.3% |
| Mean | 21.4% | 19.9% |
| Median | 21.2% | 19.9% |
| Interquartile 25% (IQ1) | 16.5% | 15.5% |
| Interquartile 75% (IQ3) | 25.4% | 25.0% |
| Interquartile Range (IQR) | 9.0% | 9.5% |
| Standard Deviation (Sample) | 8.2% | 8.2% |
| Standard Deviation (Population) | 8.1% | 8.2% |
Demographics Similar to Immigrants from Korea and Immigrants from Bolivia by Master's Degree
In terms of master's degree, the demographic groups most similar to Immigrants from Korea are Immigrants from Turkey (19.7%, a difference of 0.010%), Burmese (19.7%, a difference of 0.070%), Latvian (19.8%, a difference of 0.52%), Russian (19.5%, a difference of 0.85%), and Immigrants from Denmark (19.5%, a difference of 0.88%). Similarly, the demographic groups most similar to Immigrants from Bolivia are Immigrants from Spain (19.1%, a difference of 0.13%), Immigrants from Latvia (19.1%, a difference of 0.35%), Bolivian (19.3%, a difference of 0.77%), Immigrants from Saudi Arabia (19.0%, a difference of 0.78%), and Immigrants from Greece (19.0%, a difference of 0.79%).
| Demographics | Rating | Rank | Master's Degree |
| Immigrants | Japan | 100.0 /100 | #25 | Exceptional 20.0% |
| Cambodians | 100.0 /100 | #26 | Exceptional 20.0% |
| Immigrants | Sri Lanka | 100.0 /100 | #27 | Exceptional 19.9% |
| Turks | 100.0 /100 | #28 | Exceptional 19.9% |
| Latvians | 100.0 /100 | #29 | Exceptional 19.8% |
| Immigrants | Turkey | 100.0 /100 | #30 | Exceptional 19.7% |
| Immigrants | Korea | 100.0 /100 | #31 | Exceptional 19.7% |
| Burmese | 100.0 /100 | #32 | Exceptional 19.7% |
| Russians | 100.0 /100 | #33 | Exceptional 19.5% |
| Immigrants | Denmark | 100.0 /100 | #34 | Exceptional 19.5% |
| Immigrants | Northern Europe | 100.0 /100 | #35 | Exceptional 19.5% |
| Immigrants | Russia | 100.0 /100 | #36 | Exceptional 19.4% |
| Mongolians | 100.0 /100 | #37 | Exceptional 19.4% |
| Bolivians | 100.0 /100 | #38 | Exceptional 19.3% |
| Immigrants | Spain | 100.0 /100 | #39 | Exceptional 19.1% |
| Immigrants | Bolivia | 100.0 /100 | #40 | Exceptional 19.1% |
| Immigrants | Latvia | 100.0 /100 | #41 | Exceptional 19.1% |
| Immigrants | Saudi Arabia | 100.0 /100 | #42 | Exceptional 19.0% |
| Immigrants | Greece | 100.0 /100 | #43 | Exceptional 19.0% |
| Immigrants | Malaysia | 100.0 /100 | #44 | Exceptional 18.9% |
| Immigrants | Belarus | 100.0 /100 | #45 | Exceptional 18.9% |