Immigrants from Korea vs Alaska Native In Labor Force | Age 16-19
COMPARE
Immigrants from Korea
Alaska Native
In Labor Force | Age 16-19
In Labor Force | Age 16-19 Comparison
Immigrants from Korea
Alaska Natives
33.8%
IN LABOR FORCE | AGE 16-19
0.3/ 100
METRIC RATING
282nd/ 347
METRIC RANK
39.1%
IN LABOR FORCE | AGE 16-19
99.6/ 100
METRIC RATING
89th/ 347
METRIC RANK
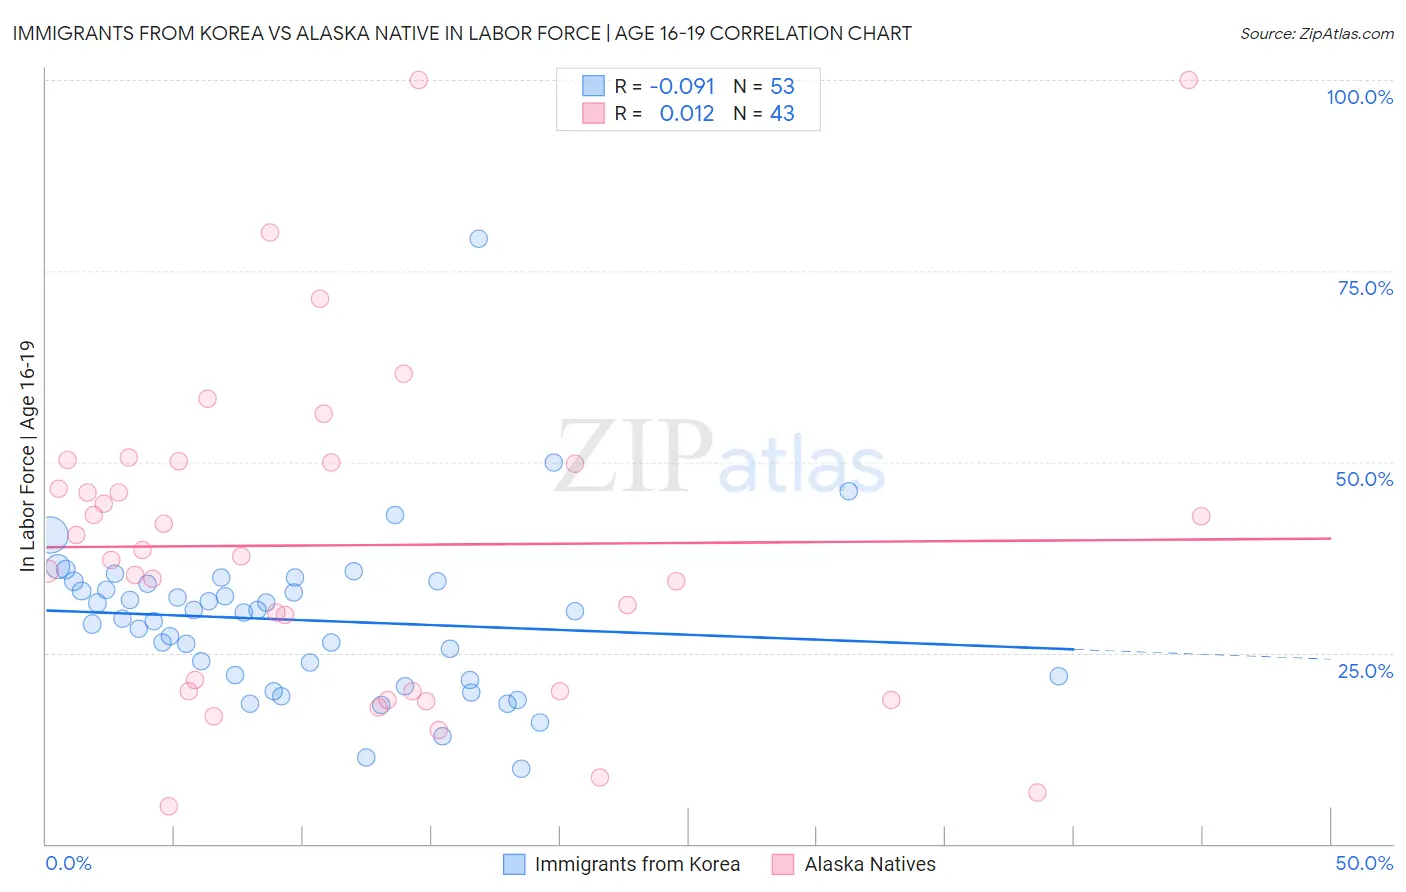
Immigrants from Korea vs Alaska Native In Labor Force | Age 16-19 Correlation Chart
The statistical analysis conducted on geographies consisting of 415,630,206 people shows a slight negative correlation between the proportion of Immigrants from Korea and labor force participation rate among population between the ages 16 and 19 in the United States with a correlation coefficient (R) of -0.091 and weighted average of 33.8%. Similarly, the statistical analysis conducted on geographies consisting of 76,723,647 people shows no correlation between the proportion of Alaska Natives and labor force participation rate among population between the ages 16 and 19 in the United States with a correlation coefficient (R) of 0.012 and weighted average of 39.1%, a difference of 15.5%.
In Labor Force | Age 16-19 Correlation Summary
| Measurement | Immigrants from Korea | Alaska Native |
| Minimum | 9.8% | 4.9% |
| Maximum | 79.2% | 100.0% |
| Range | 69.4% | 95.1% |
| Mean | 29.3% | 39.1% |
| Median | 30.3% | 37.6% |
| Interquartile 25% (IQ1) | 21.6% | 20.0% |
| Interquartile 75% (IQ3) | 34.2% | 50.0% |
| Interquartile Range (IQR) | 12.6% | 30.0% |
| Standard Deviation (Sample) | 10.9% | 21.7% |
| Standard Deviation (Population) | 10.8% | 21.4% |
Similar Demographics by In Labor Force | Age 16-19
Demographics Similar to Immigrants from Korea by In Labor Force | Age 16-19
In terms of in labor force | age 16-19, the demographic groups most similar to Immigrants from Korea are Cypriot (33.8%, a difference of 0.010%), Paraguayan (33.8%, a difference of 0.020%), Taiwanese (33.8%, a difference of 0.020%), Colombian (33.8%, a difference of 0.030%), and Menominee (33.9%, a difference of 0.11%).
| Demographics | Rating | Rank | In Labor Force | Age 16-19 |
| Immigrants | Fiji | 0.3 /100 | #275 | Tragic 33.9% |
| Immigrants | Latin America | 0.3 /100 | #276 | Tragic 33.9% |
| Menominee | 0.3 /100 | #277 | Tragic 33.9% |
| Colombians | 0.3 /100 | #278 | Tragic 33.8% |
| Paraguayans | 0.3 /100 | #279 | Tragic 33.8% |
| Taiwanese | 0.3 /100 | #280 | Tragic 33.8% |
| Cypriots | 0.3 /100 | #281 | Tragic 33.8% |
| Immigrants | Korea | 0.3 /100 | #282 | Tragic 33.8% |
| Immigrants | Venezuela | 0.2 /100 | #283 | Tragic 33.7% |
| Immigrants | Spain | 0.2 /100 | #284 | Tragic 33.7% |
| U.S. Virgin Islanders | 0.2 /100 | #285 | Tragic 33.6% |
| South Americans | 0.2 /100 | #286 | Tragic 33.6% |
| Nepalese | 0.1 /100 | #287 | Tragic 33.5% |
| Immigrants | Indonesia | 0.1 /100 | #288 | Tragic 33.5% |
| Immigrants | Singapore | 0.1 /100 | #289 | Tragic 33.5% |
Demographics Similar to Alaska Natives by In Labor Force | Age 16-19
In terms of in labor force | age 16-19, the demographic groups most similar to Alaska Natives are Puget Sound Salish (39.1%, a difference of 0.010%), Immigrants from Germany (39.1%, a difference of 0.080%), Immigrants from Burma/Myanmar (39.0%, a difference of 0.080%), Samoan (39.1%, a difference of 0.16%), and Creek (39.1%, a difference of 0.18%).
| Demographics | Rating | Rank | In Labor Force | Age 16-19 |
| Basques | 99.7 /100 | #82 | Exceptional 39.3% |
| Spanish | 99.7 /100 | #83 | Exceptional 39.3% |
| Immigrants | Uganda | 99.7 /100 | #84 | Exceptional 39.2% |
| Creek | 99.6 /100 | #85 | Exceptional 39.1% |
| Samoans | 99.6 /100 | #86 | Exceptional 39.1% |
| Immigrants | Germany | 99.6 /100 | #87 | Exceptional 39.1% |
| Puget Sound Salish | 99.6 /100 | #88 | Exceptional 39.1% |
| Alaska Natives | 99.6 /100 | #89 | Exceptional 39.1% |
| Immigrants | Burma/Myanmar | 99.5 /100 | #90 | Exceptional 39.0% |
| Spanish Americans | 99.5 /100 | #91 | Exceptional 39.0% |
| Osage | 99.4 /100 | #92 | Exceptional 39.0% |
| Blackfeet | 99.4 /100 | #93 | Exceptional 38.9% |
| Immigrants | Canada | 99.4 /100 | #94 | Exceptional 38.9% |
| Immigrants | North America | 99.4 /100 | #95 | Exceptional 38.9% |
| Latvians | 99.4 /100 | #96 | Exceptional 38.9% |