Immigrants from Kazakhstan vs Yakama Associate's Degree
COMPARE
Immigrants from Kazakhstan
Yakama
Associate's Degree
Associate's Degree Comparison
Immigrants from Kazakhstan
Yakama
51.4%
ASSOCIATE'S DEGREE
99.7/ 100
METRIC RATING
61st/ 347
METRIC RANK
32.3%
ASSOCIATE'S DEGREE
0.0/ 100
METRIC RATING
342nd/ 347
METRIC RANK
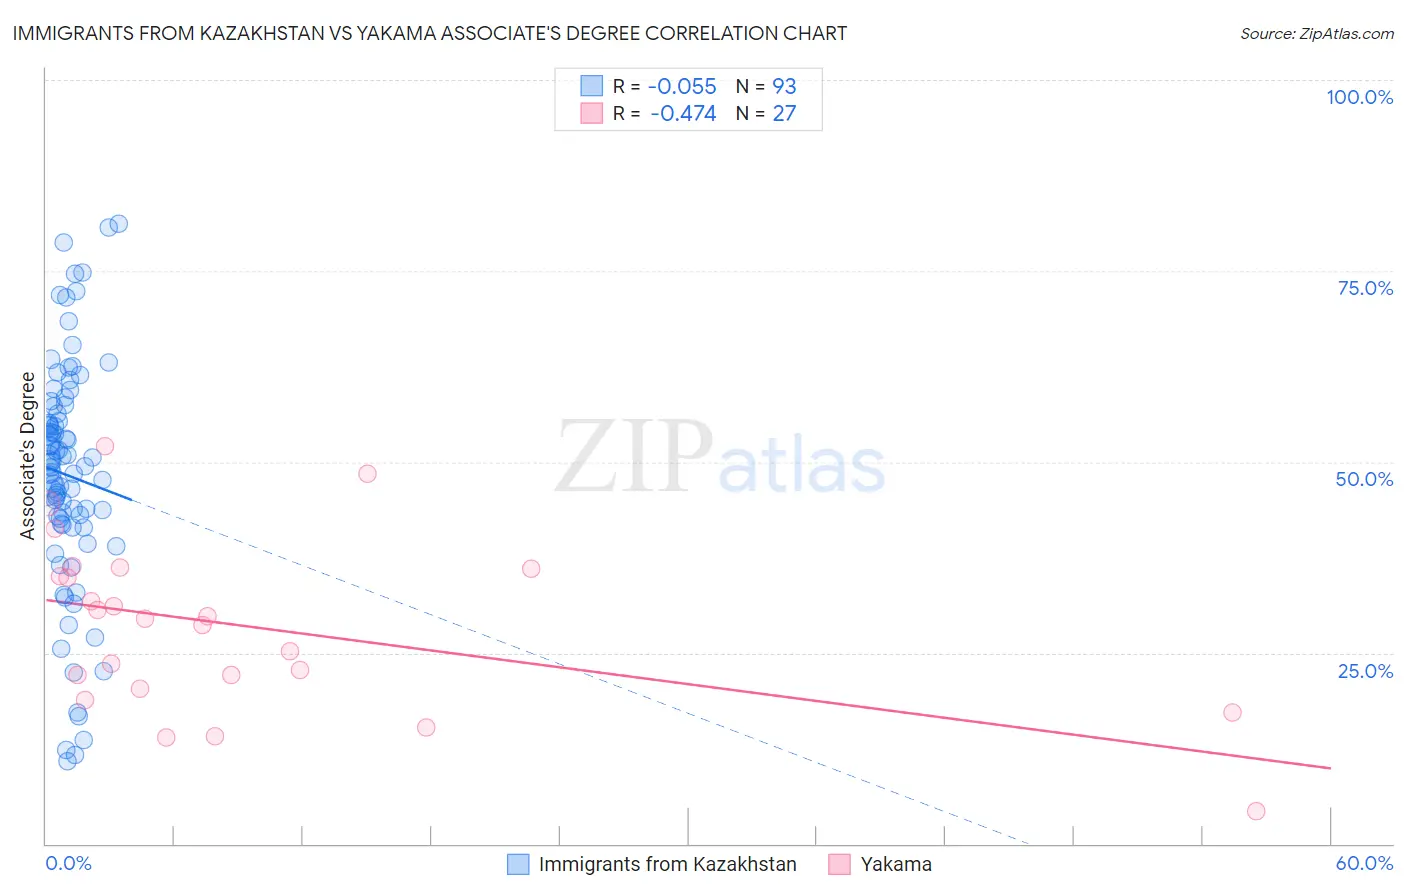
Immigrants from Kazakhstan vs Yakama Associate's Degree Correlation Chart
The statistical analysis conducted on geographies consisting of 124,444,388 people shows a slight negative correlation between the proportion of Immigrants from Kazakhstan and percentage of population with at least associate's degree education in the United States with a correlation coefficient (R) of -0.055 and weighted average of 51.4%. Similarly, the statistical analysis conducted on geographies consisting of 19,923,144 people shows a moderate negative correlation between the proportion of Yakama and percentage of population with at least associate's degree education in the United States with a correlation coefficient (R) of -0.474 and weighted average of 32.3%, a difference of 59.1%.
Associate's Degree Correlation Summary
| Measurement | Immigrants from Kazakhstan | Yakama |
| Minimum | 10.8% | 4.3% |
| Maximum | 81.2% | 52.0% |
| Range | 70.3% | 47.8% |
| Mean | 48.3% | 28.4% |
| Median | 49.4% | 29.5% |
| Interquartile 25% (IQ1) | 41.8% | 20.3% |
| Interquartile 75% (IQ3) | 56.8% | 36.0% |
| Interquartile Range (IQR) | 15.0% | 15.7% |
| Standard Deviation (Sample) | 15.2% | 11.2% |
| Standard Deviation (Population) | 15.1% | 11.0% |
Similar Demographics by Associate's Degree
Demographics Similar to Immigrants from Kazakhstan by Associate's Degree
In terms of associate's degree, the demographic groups most similar to Immigrants from Kazakhstan are Bhutanese (51.4%, a difference of 0.0%), South African (51.4%, a difference of 0.060%), Immigrants from Netherlands (51.4%, a difference of 0.13%), Immigrants from Bolivia (51.5%, a difference of 0.15%), and Zimbabwean (51.3%, a difference of 0.16%).
| Demographics | Rating | Rank | Associate's Degree |
| Immigrants | Spain | 99.8 /100 | #54 | Exceptional 51.9% |
| Australians | 99.8 /100 | #55 | Exceptional 51.9% |
| Immigrants | Czechoslovakia | 99.8 /100 | #56 | Exceptional 51.9% |
| Paraguayans | 99.8 /100 | #57 | Exceptional 51.8% |
| New Zealanders | 99.8 /100 | #58 | Exceptional 51.8% |
| Immigrants | Serbia | 99.8 /100 | #59 | Exceptional 51.7% |
| Immigrants | Bolivia | 99.7 /100 | #60 | Exceptional 51.5% |
| Immigrants | Kazakhstan | 99.7 /100 | #61 | Exceptional 51.4% |
| Bhutanese | 99.7 /100 | #62 | Exceptional 51.4% |
| South Africans | 99.7 /100 | #63 | Exceptional 51.4% |
| Immigrants | Netherlands | 99.7 /100 | #64 | Exceptional 51.4% |
| Zimbabweans | 99.7 /100 | #65 | Exceptional 51.3% |
| Immigrants | Europe | 99.7 /100 | #66 | Exceptional 51.3% |
| Argentineans | 99.6 /100 | #67 | Exceptional 51.2% |
| Immigrants | Indonesia | 99.5 /100 | #68 | Exceptional 51.0% |
Demographics Similar to Yakama by Associate's Degree
In terms of associate's degree, the demographic groups most similar to Yakama are Inupiat (32.6%, a difference of 0.77%), Navajo (32.6%, a difference of 0.83%), Tohono O'odham (31.8%, a difference of 1.7%), Yuman (31.3%, a difference of 3.4%), and Immigrants from Mexico (33.7%, a difference of 4.4%).
| Demographics | Rating | Rank | Associate's Degree |
| Mexicans | 0.0 /100 | #333 | Tragic 35.0% |
| Natives/Alaskans | 0.0 /100 | #334 | Tragic 34.9% |
| Spanish American Indians | 0.0 /100 | #335 | Tragic 34.9% |
| Hopi | 0.0 /100 | #336 | Tragic 34.6% |
| Lumbee | 0.0 /100 | #337 | Tragic 34.1% |
| Pueblo | 0.0 /100 | #338 | Tragic 34.0% |
| Immigrants | Mexico | 0.0 /100 | #339 | Tragic 33.7% |
| Navajo | 0.0 /100 | #340 | Tragic 32.6% |
| Inupiat | 0.0 /100 | #341 | Tragic 32.6% |
| Yakama | 0.0 /100 | #342 | Tragic 32.3% |
| Tohono O'odham | 0.0 /100 | #343 | Tragic 31.8% |
| Yuman | 0.0 /100 | #344 | Tragic 31.3% |
| Pima | 0.0 /100 | #345 | Tragic 30.2% |
| Houma | 0.0 /100 | #346 | Tragic 28.2% |
| Yup'ik | 0.0 /100 | #347 | Tragic 25.0% |