Immigrants from Kazakhstan vs Thai Associate's Degree
COMPARE
Immigrants from Kazakhstan
Thai
Associate's Degree
Associate's Degree Comparison
Immigrants from Kazakhstan
Thais
51.4%
ASSOCIATE'S DEGREE
99.7/ 100
METRIC RATING
61st/ 347
METRIC RANK
57.4%
ASSOCIATE'S DEGREE
100.0/ 100
METRIC RATING
8th/ 347
METRIC RANK
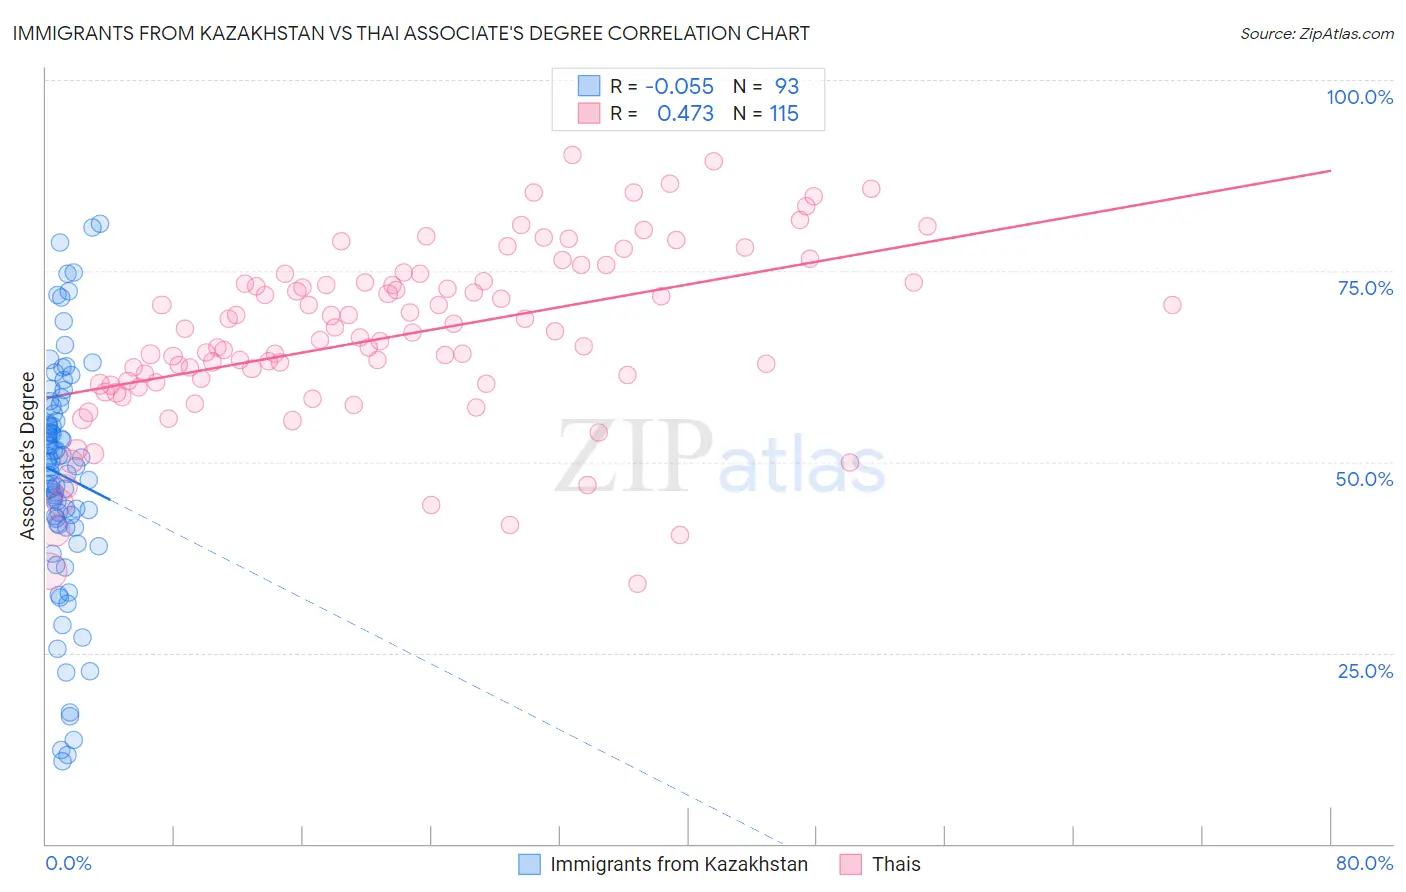
Immigrants from Kazakhstan vs Thai Associate's Degree Correlation Chart
The statistical analysis conducted on geographies consisting of 124,444,388 people shows a slight negative correlation between the proportion of Immigrants from Kazakhstan and percentage of population with at least associate's degree education in the United States with a correlation coefficient (R) of -0.055 and weighted average of 51.4%. Similarly, the statistical analysis conducted on geographies consisting of 475,760,266 people shows a moderate positive correlation between the proportion of Thais and percentage of population with at least associate's degree education in the United States with a correlation coefficient (R) of 0.473 and weighted average of 57.4%, a difference of 11.7%.
Associate's Degree Correlation Summary
| Measurement | Immigrants from Kazakhstan | Thai |
| Minimum | 10.8% | 34.0% |
| Maximum | 81.2% | 90.2% |
| Range | 70.3% | 56.3% |
| Mean | 48.3% | 66.5% |
| Median | 49.4% | 66.9% |
| Interquartile 25% (IQ1) | 41.8% | 60.1% |
| Interquartile 75% (IQ3) | 56.8% | 73.5% |
| Interquartile Range (IQR) | 15.0% | 13.3% |
| Standard Deviation (Sample) | 15.2% | 11.4% |
| Standard Deviation (Population) | 15.1% | 11.4% |
Similar Demographics by Associate's Degree
Demographics Similar to Immigrants from Kazakhstan by Associate's Degree
In terms of associate's degree, the demographic groups most similar to Immigrants from Kazakhstan are Bhutanese (51.4%, a difference of 0.0%), South African (51.4%, a difference of 0.060%), Immigrants from Netherlands (51.4%, a difference of 0.13%), Immigrants from Bolivia (51.5%, a difference of 0.15%), and Zimbabwean (51.3%, a difference of 0.16%).
| Demographics | Rating | Rank | Associate's Degree |
| Immigrants | Spain | 99.8 /100 | #54 | Exceptional 51.9% |
| Australians | 99.8 /100 | #55 | Exceptional 51.9% |
| Immigrants | Czechoslovakia | 99.8 /100 | #56 | Exceptional 51.9% |
| Paraguayans | 99.8 /100 | #57 | Exceptional 51.8% |
| New Zealanders | 99.8 /100 | #58 | Exceptional 51.8% |
| Immigrants | Serbia | 99.8 /100 | #59 | Exceptional 51.7% |
| Immigrants | Bolivia | 99.7 /100 | #60 | Exceptional 51.5% |
| Immigrants | Kazakhstan | 99.7 /100 | #61 | Exceptional 51.4% |
| Bhutanese | 99.7 /100 | #62 | Exceptional 51.4% |
| South Africans | 99.7 /100 | #63 | Exceptional 51.4% |
| Immigrants | Netherlands | 99.7 /100 | #64 | Exceptional 51.4% |
| Zimbabweans | 99.7 /100 | #65 | Exceptional 51.3% |
| Immigrants | Europe | 99.7 /100 | #66 | Exceptional 51.3% |
| Argentineans | 99.6 /100 | #67 | Exceptional 51.2% |
| Immigrants | Indonesia | 99.5 /100 | #68 | Exceptional 51.0% |
Demographics Similar to Thais by Associate's Degree
In terms of associate's degree, the demographic groups most similar to Thais are Immigrants from Iran (57.7%, a difference of 0.40%), Okinawan (57.7%, a difference of 0.46%), Immigrants from Israel (56.8%, a difference of 1.1%), Iranian (58.2%, a difference of 1.3%), and Immigrants from Taiwan (58.4%, a difference of 1.7%).
| Demographics | Rating | Rank | Associate's Degree |
| Filipinos | 100.0 /100 | #1 | Exceptional 59.8% |
| Immigrants | Singapore | 100.0 /100 | #2 | Exceptional 58.9% |
| Immigrants | India | 100.0 /100 | #3 | Exceptional 58.5% |
| Immigrants | Taiwan | 100.0 /100 | #4 | Exceptional 58.4% |
| Iranians | 100.0 /100 | #5 | Exceptional 58.2% |
| Okinawans | 100.0 /100 | #6 | Exceptional 57.7% |
| Immigrants | Iran | 100.0 /100 | #7 | Exceptional 57.7% |
| Thais | 100.0 /100 | #8 | Exceptional 57.4% |
| Immigrants | Israel | 100.0 /100 | #9 | Exceptional 56.8% |
| Cypriots | 100.0 /100 | #10 | Exceptional 56.4% |
| Immigrants | Australia | 100.0 /100 | #11 | Exceptional 55.8% |
| Immigrants | South Central Asia | 100.0 /100 | #12 | Exceptional 55.7% |
| Immigrants | China | 100.0 /100 | #13 | Exceptional 55.5% |
| Immigrants | Hong Kong | 100.0 /100 | #14 | Exceptional 55.4% |
| Immigrants | Eastern Asia | 100.0 /100 | #15 | Exceptional 55.4% |