Immigrants from Kazakhstan vs Black/African American Unemployment Among Ages 65 to 74 years
COMPARE
Immigrants from Kazakhstan
Black/African American
Unemployment Among Ages 65 to 74 years
Unemployment Among Ages 65 to 74 years Comparison
Immigrants from Kazakhstan
Blacks/African Americans
5.1%
UNEMPLOYMENT AMONG AGES 65 TO 74 YEARS
99.7/ 100
METRIC RATING
51st/ 347
METRIC RANK
5.8%
UNEMPLOYMENT AMONG AGES 65 TO 74 YEARS
0.0/ 100
METRIC RATING
295th/ 347
METRIC RANK
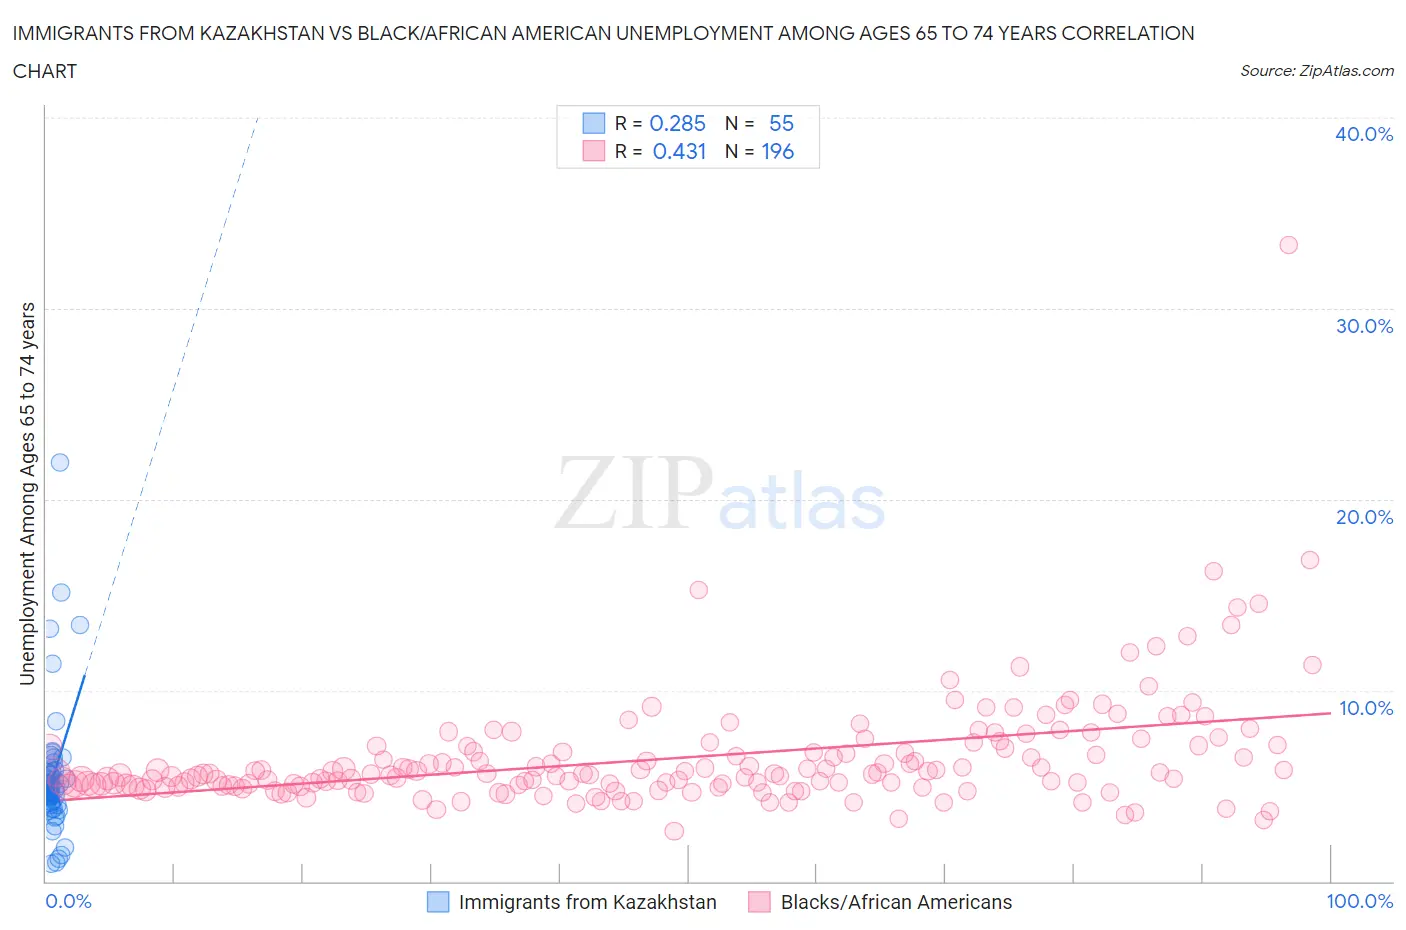
Immigrants from Kazakhstan vs Black/African American Unemployment Among Ages 65 to 74 years Correlation Chart
The statistical analysis conducted on geographies consisting of 118,784,088 people shows a weak positive correlation between the proportion of Immigrants from Kazakhstan and unemployment rate among population between the ages 65 and 74 in the United States with a correlation coefficient (R) of 0.285 and weighted average of 5.1%. Similarly, the statistical analysis conducted on geographies consisting of 445,511,651 people shows a moderate positive correlation between the proportion of Blacks/African Americans and unemployment rate among population between the ages 65 and 74 in the United States with a correlation coefficient (R) of 0.431 and weighted average of 5.8%, a difference of 13.0%.
Unemployment Among Ages 65 to 74 years Correlation Summary
| Measurement | Immigrants from Kazakhstan | Black/African American |
| Minimum | 0.90% | 2.6% |
| Maximum | 21.9% | 33.3% |
| Range | 21.0% | 30.7% |
| Mean | 5.5% | 6.5% |
| Median | 4.8% | 5.6% |
| Interquartile 25% (IQ1) | 4.0% | 5.0% |
| Interquartile 75% (IQ3) | 5.7% | 7.1% |
| Interquartile Range (IQR) | 1.7% | 2.1% |
| Standard Deviation (Sample) | 3.6% | 3.0% |
| Standard Deviation (Population) | 3.5% | 3.0% |
Similar Demographics by Unemployment Among Ages 65 to 74 years
Demographics Similar to Immigrants from Kazakhstan by Unemployment Among Ages 65 to 74 years
In terms of unemployment among ages 65 to 74 years, the demographic groups most similar to Immigrants from Kazakhstan are Immigrants from Zimbabwe (5.1%, a difference of 0.020%), Immigrants from Austria (5.1%, a difference of 0.19%), Choctaw (5.1%, a difference of 0.20%), European (5.1%, a difference of 0.26%), and Immigrants from Ethiopia (5.1%, a difference of 0.27%).
| Demographics | Rating | Rank | Unemployment Among Ages 65 to 74 years |
| Immigrants | India | 99.9 /100 | #44 | Exceptional 5.1% |
| Sioux | 99.8 /100 | #45 | Exceptional 5.1% |
| Immigrants | Kenya | 99.8 /100 | #46 | Exceptional 5.1% |
| Immigrants | Uganda | 99.8 /100 | #47 | Exceptional 5.1% |
| Choctaw | 99.8 /100 | #48 | Exceptional 5.1% |
| Immigrants | Austria | 99.8 /100 | #49 | Exceptional 5.1% |
| Immigrants | Zimbabwe | 99.7 /100 | #50 | Exceptional 5.1% |
| Immigrants | Kazakhstan | 99.7 /100 | #51 | Exceptional 5.1% |
| Europeans | 99.6 /100 | #52 | Exceptional 5.1% |
| Immigrants | Ethiopia | 99.6 /100 | #53 | Exceptional 5.1% |
| Immigrants | Nicaragua | 99.6 /100 | #54 | Exceptional 5.1% |
| Carpatho Rusyns | 99.6 /100 | #55 | Exceptional 5.1% |
| Swedes | 99.5 /100 | #56 | Exceptional 5.1% |
| Croatians | 99.5 /100 | #57 | Exceptional 5.1% |
| Germans | 99.5 /100 | #58 | Exceptional 5.1% |
Demographics Similar to Blacks/African Americans by Unemployment Among Ages 65 to 74 years
In terms of unemployment among ages 65 to 74 years, the demographic groups most similar to Blacks/African Americans are Immigrants from Morocco (5.8%, a difference of 0.030%), Immigrants from Grenada (5.8%, a difference of 0.060%), U.S. Virgin Islander (5.8%, a difference of 0.16%), Portuguese (5.7%, a difference of 0.38%), and Spanish American Indian (5.7%, a difference of 0.41%).
| Demographics | Rating | Rank | Unemployment Among Ages 65 to 74 years |
| Central Americans | 0.0 /100 | #288 | Tragic 5.7% |
| Immigrants | Somalia | 0.0 /100 | #289 | Tragic 5.7% |
| Spanish American Indians | 0.0 /100 | #290 | Tragic 5.7% |
| Portuguese | 0.0 /100 | #291 | Tragic 5.7% |
| U.S. Virgin Islanders | 0.0 /100 | #292 | Tragic 5.8% |
| Immigrants | Grenada | 0.0 /100 | #293 | Tragic 5.8% |
| Immigrants | Morocco | 0.0 /100 | #294 | Tragic 5.8% |
| Blacks/African Americans | 0.0 /100 | #295 | Tragic 5.8% |
| Pennsylvania Germans | 0.0 /100 | #296 | Tragic 5.8% |
| Houma | 0.0 /100 | #297 | Tragic 5.8% |
| Immigrants | Latin America | 0.0 /100 | #298 | Tragic 5.8% |
| Barbadians | 0.0 /100 | #299 | Tragic 5.8% |
| Ecuadorians | 0.0 /100 | #300 | Tragic 5.8% |
| Armenians | 0.0 /100 | #301 | Tragic 5.8% |
| Liberians | 0.0 /100 | #302 | Tragic 5.8% |