Immigrants from Jordan vs Cuban 9th Grade
COMPARE
Immigrants from Jordan
Cuban
9th Grade
9th Grade Comparison
Immigrants from Jordan
Cubans
95.1%
9TH GRADE
81.2/ 100
METRIC RATING
148th/ 347
METRIC RANK
93.2%
9TH GRADE
0.0/ 100
METRIC RATING
294th/ 347
METRIC RANK
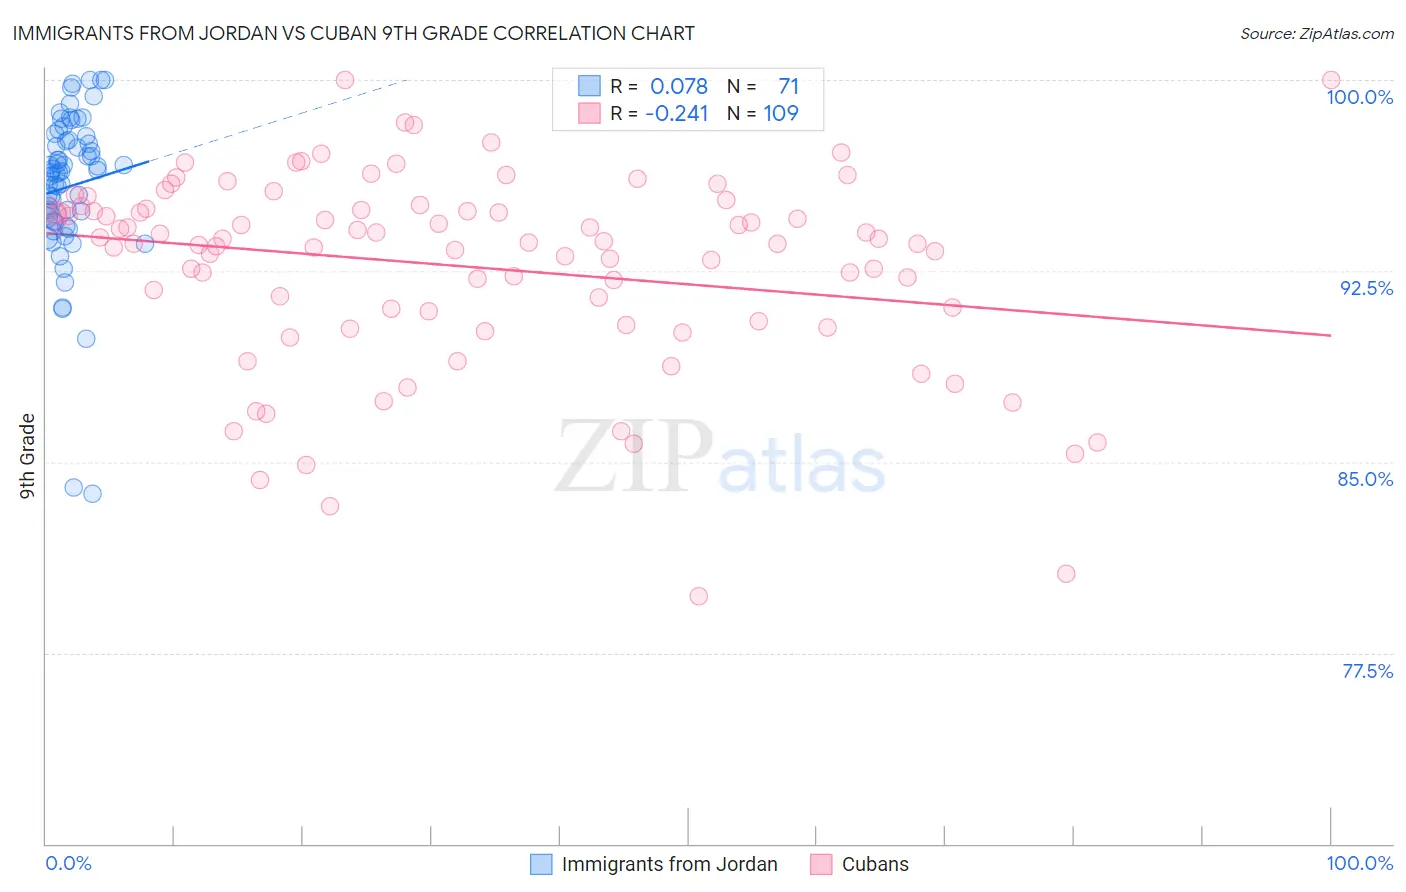
Immigrants from Jordan vs Cuban 9th Grade Correlation Chart
The statistical analysis conducted on geographies consisting of 181,278,272 people shows a slight positive correlation between the proportion of Immigrants from Jordan and percentage of population with at least 9th grade education in the United States with a correlation coefficient (R) of 0.078 and weighted average of 95.1%. Similarly, the statistical analysis conducted on geographies consisting of 449,368,946 people shows a weak negative correlation between the proportion of Cubans and percentage of population with at least 9th grade education in the United States with a correlation coefficient (R) of -0.241 and weighted average of 93.2%, a difference of 2.1%.
9th Grade Correlation Summary
| Measurement | Immigrants from Jordan | Cuban |
| Minimum | 83.7% | 79.7% |
| Maximum | 100.0% | 100.0% |
| Range | 16.3% | 20.3% |
| Mean | 95.8% | 92.7% |
| Median | 96.4% | 93.6% |
| Interquartile 25% (IQ1) | 94.5% | 90.7% |
| Interquartile 75% (IQ3) | 97.6% | 94.9% |
| Interquartile Range (IQR) | 3.2% | 4.2% |
| Standard Deviation (Sample) | 3.0% | 3.8% |
| Standard Deviation (Population) | 3.0% | 3.8% |
Similar Demographics by 9th Grade
Demographics Similar to Immigrants from Jordan by 9th Grade
In terms of 9th grade, the demographic groups most similar to Immigrants from Jordan are Pueblo (95.1%, a difference of 0.010%), Immigrants from Sri Lanka (95.1%, a difference of 0.010%), Choctaw (95.1%, a difference of 0.010%), Immigrants from Korea (95.1%, a difference of 0.020%), and Kenyan (95.1%, a difference of 0.020%).
| Demographics | Rating | Rank | 9th Grade |
| Immigrants | Bosnia and Herzegovina | 85.2 /100 | #141 | Excellent 95.2% |
| Immigrants | Greece | 84.6 /100 | #142 | Excellent 95.2% |
| Spanish | 84.4 /100 | #143 | Excellent 95.2% |
| Yup'ik | 83.3 /100 | #144 | Excellent 95.2% |
| Pueblo | 82.2 /100 | #145 | Excellent 95.1% |
| Immigrants | Sri Lanka | 82.1 /100 | #146 | Excellent 95.1% |
| Choctaw | 81.9 /100 | #147 | Excellent 95.1% |
| Immigrants | Jordan | 81.2 /100 | #148 | Excellent 95.1% |
| Immigrants | Korea | 79.6 /100 | #149 | Good 95.1% |
| Kenyans | 79.1 /100 | #150 | Good 95.1% |
| Cajuns | 77.3 /100 | #151 | Good 95.1% |
| Ugandans | 77.0 /100 | #152 | Good 95.1% |
| Albanians | 76.1 /100 | #153 | Good 95.1% |
| Arabs | 74.9 /100 | #154 | Good 95.1% |
| Immigrants | Kazakhstan | 74.7 /100 | #155 | Good 95.1% |
Demographics Similar to Cubans by 9th Grade
In terms of 9th grade, the demographic groups most similar to Cubans are Sri Lankan (93.2%, a difference of 0.0%), Immigrants from Laos (93.2%, a difference of 0.020%), Immigrants from Burma/Myanmar (93.1%, a difference of 0.020%), Indonesian (93.1%, a difference of 0.020%), and British West Indian (93.2%, a difference of 0.030%).
| Demographics | Rating | Rank | 9th Grade |
| Immigrants | St. Vincent and the Grenadines | 0.0 /100 | #287 | Tragic 93.4% |
| Immigrants | South Eastern Asia | 0.0 /100 | #288 | Tragic 93.3% |
| Immigrants | West Indies | 0.0 /100 | #289 | Tragic 93.3% |
| Pennsylvania Germans | 0.0 /100 | #290 | Tragic 93.3% |
| British West Indians | 0.0 /100 | #291 | Tragic 93.2% |
| Immigrants | Laos | 0.0 /100 | #292 | Tragic 93.2% |
| Sri Lankans | 0.0 /100 | #293 | Tragic 93.2% |
| Cubans | 0.0 /100 | #294 | Tragic 93.2% |
| Immigrants | Burma/Myanmar | 0.0 /100 | #295 | Tragic 93.1% |
| Indonesians | 0.0 /100 | #296 | Tragic 93.1% |
| Fijians | 0.0 /100 | #297 | Tragic 93.1% |
| Haitians | 0.0 /100 | #298 | Tragic 93.1% |
| Immigrants | Grenada | 0.0 /100 | #299 | Tragic 93.0% |
| Yaqui | 0.0 /100 | #300 | Tragic 92.9% |
| Immigrants | Haiti | 0.0 /100 | #301 | Tragic 92.7% |