Immigrants from Jamaica vs Finnish Associate's Degree
COMPARE
Immigrants from Jamaica
Finnish
Associate's Degree
Associate's Degree Comparison
Immigrants from Jamaica
Finns
41.5%
ASSOCIATE'S DEGREE
0.3/ 100
METRIC RATING
263rd/ 347
METRIC RANK
46.3%
ASSOCIATE'S DEGREE
48.5/ 100
METRIC RATING
176th/ 347
METRIC RANK
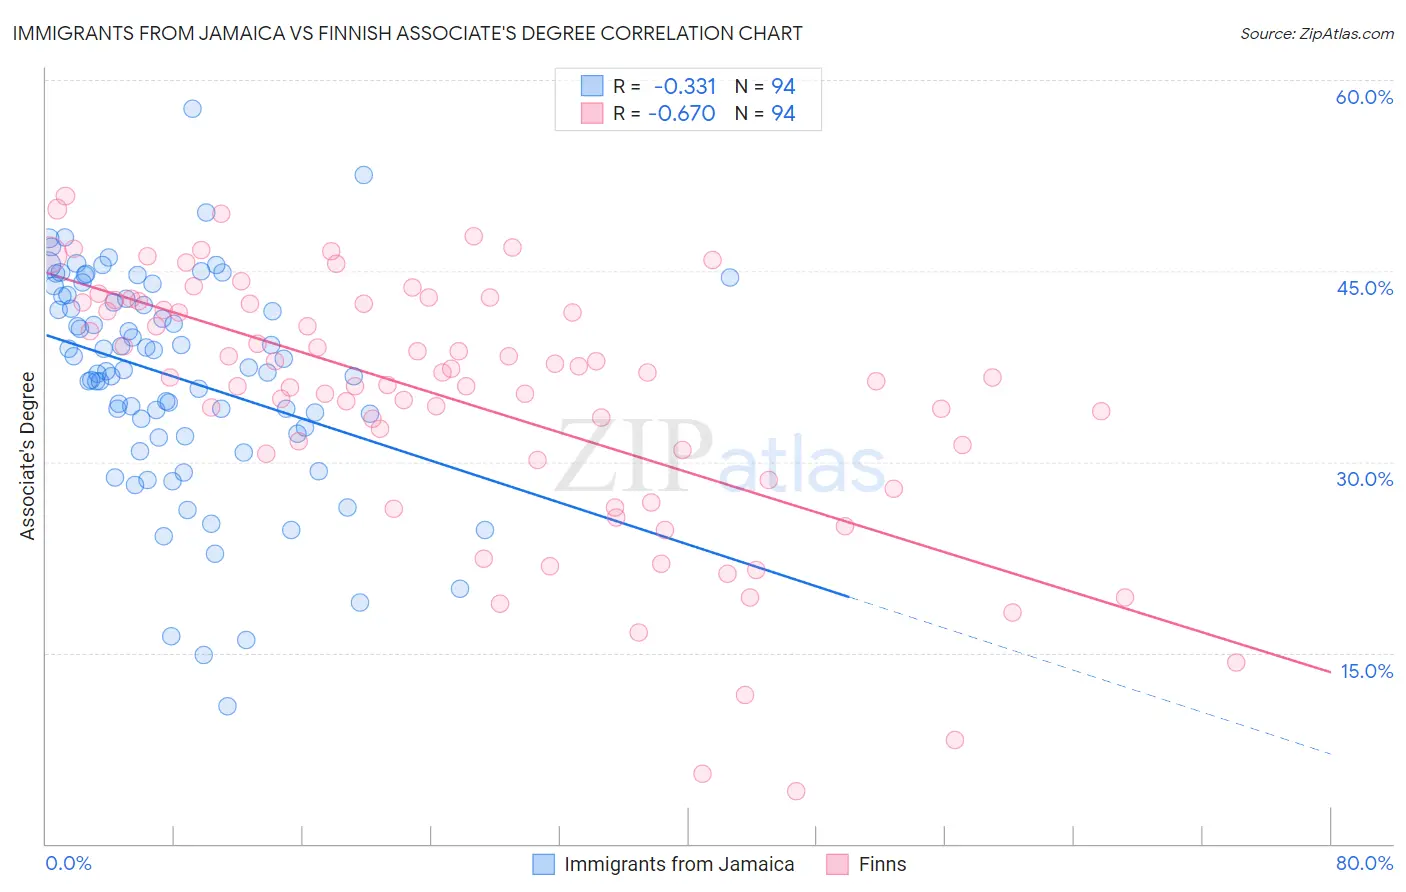
Immigrants from Jamaica vs Finnish Associate's Degree Correlation Chart
The statistical analysis conducted on geographies consisting of 301,813,943 people shows a mild negative correlation between the proportion of Immigrants from Jamaica and percentage of population with at least associate's degree education in the United States with a correlation coefficient (R) of -0.331 and weighted average of 41.5%. Similarly, the statistical analysis conducted on geographies consisting of 404,653,186 people shows a significant negative correlation between the proportion of Finns and percentage of population with at least associate's degree education in the United States with a correlation coefficient (R) of -0.670 and weighted average of 46.3%, a difference of 11.7%.
Associate's Degree Correlation Summary
| Measurement | Immigrants from Jamaica | Finnish |
| Minimum | 10.8% | 4.1% |
| Maximum | 57.7% | 50.9% |
| Range | 46.9% | 46.8% |
| Mean | 36.6% | 34.7% |
| Median | 37.3% | 36.6% |
| Interquartile 25% (IQ1) | 32.3% | 30.2% |
| Interquartile 75% (IQ3) | 43.1% | 42.4% |
| Interquartile Range (IQR) | 10.8% | 12.3% |
| Standard Deviation (Sample) | 8.6% | 10.2% |
| Standard Deviation (Population) | 8.6% | 10.1% |
Similar Demographics by Associate's Degree
Demographics Similar to Immigrants from Jamaica by Associate's Degree
In terms of associate's degree, the demographic groups most similar to Immigrants from Jamaica are Osage (41.5%, a difference of 0.010%), Bahamian (41.5%, a difference of 0.020%), Nicaraguan (41.5%, a difference of 0.11%), Marshallese (41.6%, a difference of 0.24%), and Malaysian (41.6%, a difference of 0.43%).
| Demographics | Rating | Rank | Associate's Degree |
| Immigrants | Congo | 0.5 /100 | #256 | Tragic 41.8% |
| Spanish Americans | 0.5 /100 | #257 | Tragic 41.8% |
| Japanese | 0.5 /100 | #258 | Tragic 41.7% |
| Malaysians | 0.4 /100 | #259 | Tragic 41.6% |
| Marshallese | 0.4 /100 | #260 | Tragic 41.6% |
| Nicaraguans | 0.4 /100 | #261 | Tragic 41.5% |
| Bahamians | 0.4 /100 | #262 | Tragic 41.5% |
| Immigrants | Jamaica | 0.3 /100 | #263 | Tragic 41.5% |
| Osage | 0.3 /100 | #264 | Tragic 41.5% |
| Africans | 0.2 /100 | #265 | Tragic 41.1% |
| Samoans | 0.2 /100 | #266 | Tragic 41.1% |
| Hawaiians | 0.2 /100 | #267 | Tragic 40.9% |
| Central American Indians | 0.2 /100 | #268 | Tragic 40.8% |
| Americans | 0.2 /100 | #269 | Tragic 40.8% |
| Chippewa | 0.2 /100 | #270 | Tragic 40.7% |
Demographics Similar to Finns by Associate's Degree
In terms of associate's degree, the demographic groups most similar to Finns are Slovak (46.3%, a difference of 0.010%), Belgian (46.3%, a difference of 0.020%), Immigrants from Bosnia and Herzegovina (46.3%, a difference of 0.020%), Sri Lankan (46.3%, a difference of 0.070%), and English (46.4%, a difference of 0.11%).
| Demographics | Rating | Rank | Associate's Degree |
| Uruguayans | 55.4 /100 | #169 | Average 46.5% |
| Irish | 53.6 /100 | #170 | Average 46.5% |
| Basques | 52.8 /100 | #171 | Average 46.5% |
| Peruvians | 50.5 /100 | #172 | Average 46.4% |
| Immigrants | Iraq | 50.3 /100 | #173 | Average 46.4% |
| English | 50.0 /100 | #174 | Average 46.4% |
| Belgians | 48.9 /100 | #175 | Average 46.3% |
| Finns | 48.5 /100 | #176 | Average 46.3% |
| Slovaks | 48.4 /100 | #177 | Average 46.3% |
| Immigrants | Bosnia and Herzegovina | 48.3 /100 | #178 | Average 46.3% |
| Sri Lankans | 47.6 /100 | #179 | Average 46.3% |
| Bermudans | 46.4 /100 | #180 | Average 46.2% |
| Immigrants | Colombia | 41.3 /100 | #181 | Average 46.0% |
| Swiss | 40.4 /100 | #182 | Average 46.0% |
| Yugoslavians | 40.2 /100 | #183 | Average 46.0% |