Immigrants from Jamaica vs Yup'ik Associate's Degree
COMPARE
Immigrants from Jamaica
Yup'ik
Associate's Degree
Associate's Degree Comparison
Immigrants from Jamaica
Yup'ik
41.5%
ASSOCIATE'S DEGREE
0.3/ 100
METRIC RATING
263rd/ 347
METRIC RANK
25.0%
ASSOCIATE'S DEGREE
0.0/ 100
METRIC RATING
347th/ 347
METRIC RANK
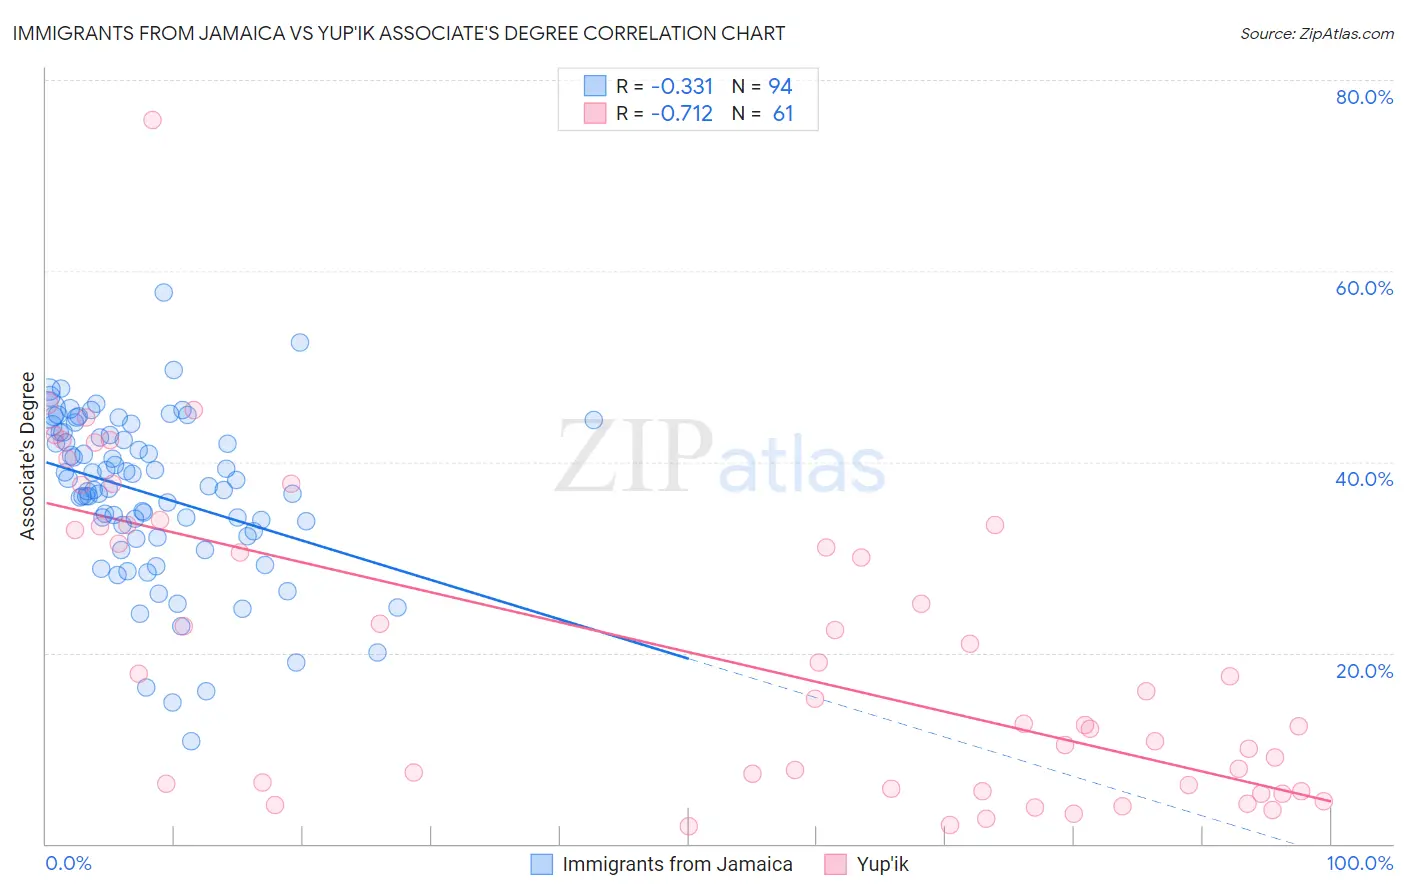
Immigrants from Jamaica vs Yup'ik Associate's Degree Correlation Chart
The statistical analysis conducted on geographies consisting of 301,813,943 people shows a mild negative correlation between the proportion of Immigrants from Jamaica and percentage of population with at least associate's degree education in the United States with a correlation coefficient (R) of -0.331 and weighted average of 41.5%. Similarly, the statistical analysis conducted on geographies consisting of 39,962,242 people shows a strong negative correlation between the proportion of Yup'ik and percentage of population with at least associate's degree education in the United States with a correlation coefficient (R) of -0.712 and weighted average of 25.0%, a difference of 66.1%.
Associate's Degree Correlation Summary
| Measurement | Immigrants from Jamaica | Yup'ik |
| Minimum | 10.8% | 1.8% |
| Maximum | 57.7% | 75.8% |
| Range | 46.9% | 74.0% |
| Mean | 36.6% | 20.1% |
| Median | 37.3% | 15.2% |
| Interquartile 25% (IQ1) | 32.3% | 5.9% |
| Interquartile 75% (IQ3) | 43.1% | 33.3% |
| Interquartile Range (IQR) | 10.8% | 27.4% |
| Standard Deviation (Sample) | 8.6% | 16.1% |
| Standard Deviation (Population) | 8.6% | 16.0% |
Similar Demographics by Associate's Degree
Demographics Similar to Immigrants from Jamaica by Associate's Degree
In terms of associate's degree, the demographic groups most similar to Immigrants from Jamaica are Osage (41.5%, a difference of 0.010%), Bahamian (41.5%, a difference of 0.020%), Nicaraguan (41.5%, a difference of 0.11%), Marshallese (41.6%, a difference of 0.24%), and Malaysian (41.6%, a difference of 0.43%).
| Demographics | Rating | Rank | Associate's Degree |
| Immigrants | Congo | 0.5 /100 | #256 | Tragic 41.8% |
| Spanish Americans | 0.5 /100 | #257 | Tragic 41.8% |
| Japanese | 0.5 /100 | #258 | Tragic 41.7% |
| Malaysians | 0.4 /100 | #259 | Tragic 41.6% |
| Marshallese | 0.4 /100 | #260 | Tragic 41.6% |
| Nicaraguans | 0.4 /100 | #261 | Tragic 41.5% |
| Bahamians | 0.4 /100 | #262 | Tragic 41.5% |
| Immigrants | Jamaica | 0.3 /100 | #263 | Tragic 41.5% |
| Osage | 0.3 /100 | #264 | Tragic 41.5% |
| Africans | 0.2 /100 | #265 | Tragic 41.1% |
| Samoans | 0.2 /100 | #266 | Tragic 41.1% |
| Hawaiians | 0.2 /100 | #267 | Tragic 40.9% |
| Central American Indians | 0.2 /100 | #268 | Tragic 40.8% |
| Americans | 0.2 /100 | #269 | Tragic 40.8% |
| Chippewa | 0.2 /100 | #270 | Tragic 40.7% |
Demographics Similar to Yup'ik by Associate's Degree
In terms of associate's degree, the demographic groups most similar to Yup'ik are Houma (28.2%, a difference of 13.0%), Pima (30.2%, a difference of 21.1%), Yuman (31.3%, a difference of 25.2%), Tohono O'odham (31.8%, a difference of 27.3%), and Yakama (32.3%, a difference of 29.5%).
| Demographics | Rating | Rank | Associate's Degree |
| Mexicans | 0.0 /100 | #333 | Tragic 35.0% |
| Natives/Alaskans | 0.0 /100 | #334 | Tragic 34.9% |
| Spanish American Indians | 0.0 /100 | #335 | Tragic 34.9% |
| Hopi | 0.0 /100 | #336 | Tragic 34.6% |
| Lumbee | 0.0 /100 | #337 | Tragic 34.1% |
| Pueblo | 0.0 /100 | #338 | Tragic 34.0% |
| Immigrants | Mexico | 0.0 /100 | #339 | Tragic 33.7% |
| Navajo | 0.0 /100 | #340 | Tragic 32.6% |
| Inupiat | 0.0 /100 | #341 | Tragic 32.6% |
| Yakama | 0.0 /100 | #342 | Tragic 32.3% |
| Tohono O'odham | 0.0 /100 | #343 | Tragic 31.8% |
| Yuman | 0.0 /100 | #344 | Tragic 31.3% |
| Pima | 0.0 /100 | #345 | Tragic 30.2% |
| Houma | 0.0 /100 | #346 | Tragic 28.2% |
| Yup'ik | 0.0 /100 | #347 | Tragic 25.0% |