Immigrants from Moldova vs Immigrants from Poland GED/Equivalency
COMPARE
Immigrants from Moldova
Immigrants from Poland
GED/Equivalency
GED/Equivalency Comparison
Immigrants from Moldova
Immigrants from Poland
87.7%
GED/EQUIVALENCY
98.8/ 100
METRIC RATING
72nd/ 347
METRIC RANK
86.3%
GED/EQUIVALENCY
79.3/ 100
METRIC RATING
148th/ 347
METRIC RANK
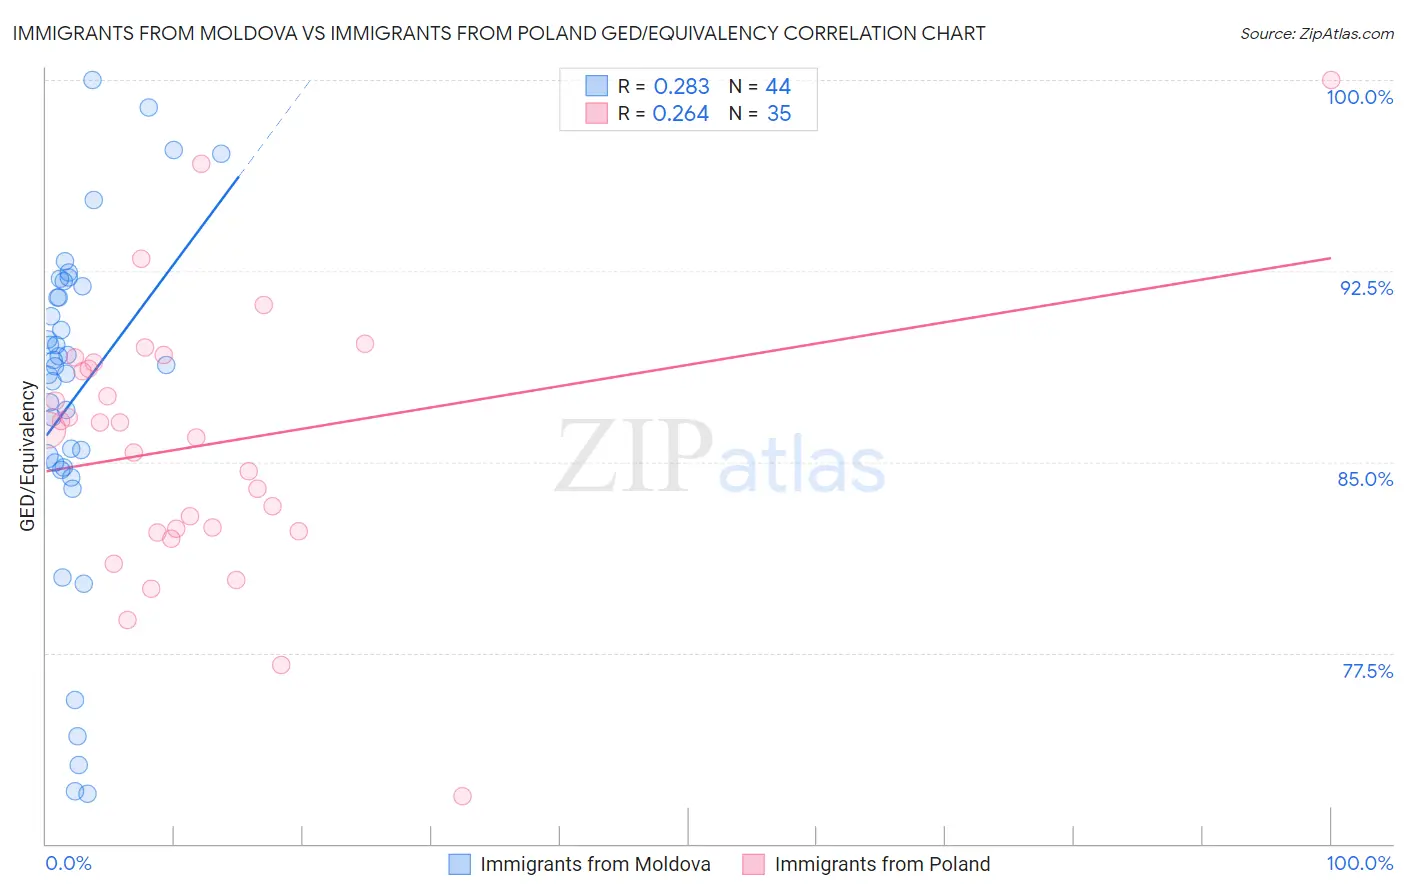
Immigrants from Moldova vs Immigrants from Poland GED/Equivalency Correlation Chart
The statistical analysis conducted on geographies consisting of 124,401,069 people shows a weak positive correlation between the proportion of Immigrants from Moldova and percentage of population with at least ged/equivalency education in the United States with a correlation coefficient (R) of 0.283 and weighted average of 87.7%. Similarly, the statistical analysis conducted on geographies consisting of 304,861,877 people shows a weak positive correlation between the proportion of Immigrants from Poland and percentage of population with at least ged/equivalency education in the United States with a correlation coefficient (R) of 0.264 and weighted average of 86.3%, a difference of 1.6%.
GED/Equivalency Correlation Summary
| Measurement | Immigrants from Moldova | Immigrants from Poland |
| Minimum | 72.0% | 71.9% |
| Maximum | 100.0% | 100.0% |
| Range | 28.0% | 28.1% |
| Mean | 87.6% | 85.7% |
| Median | 88.8% | 86.2% |
| Interquartile 25% (IQ1) | 84.9% | 82.3% |
| Interquartile 75% (IQ3) | 91.7% | 88.9% |
| Interquartile Range (IQR) | 6.8% | 6.6% |
| Standard Deviation (Sample) | 6.7% | 5.4% |
| Standard Deviation (Population) | 6.6% | 5.3% |
Similar Demographics by GED/Equivalency
Demographics Similar to Immigrants from Moldova by GED/Equivalency
In terms of ged/equivalency, the demographic groups most similar to Immigrants from Moldova are Ukrainian (87.7%, a difference of 0.0%), Austrian (87.7%, a difference of 0.0%), Belgian (87.7%, a difference of 0.010%), Immigrants from Kuwait (87.7%, a difference of 0.030%), and Immigrants from Saudi Arabia (87.8%, a difference of 0.050%).
| Demographics | Rating | Rank | GED/Equivalency |
| Immigrants | North America | 99.1 /100 | #65 | Exceptional 87.8% |
| Immigrants | Bulgaria | 99.1 /100 | #66 | Exceptional 87.8% |
| British | 99.1 /100 | #67 | Exceptional 87.8% |
| Immigrants | France | 99.1 /100 | #68 | Exceptional 87.8% |
| Immigrants | Saudi Arabia | 99.0 /100 | #69 | Exceptional 87.8% |
| Ukrainians | 98.8 /100 | #70 | Exceptional 87.7% |
| Austrians | 98.8 /100 | #71 | Exceptional 87.7% |
| Immigrants | Moldova | 98.8 /100 | #72 | Exceptional 87.7% |
| Belgians | 98.8 /100 | #73 | Exceptional 87.7% |
| Immigrants | Kuwait | 98.8 /100 | #74 | Exceptional 87.7% |
| Scottish | 98.7 /100 | #75 | Exceptional 87.7% |
| Immigrants | Serbia | 98.7 /100 | #76 | Exceptional 87.7% |
| Slavs | 98.7 /100 | #77 | Exceptional 87.7% |
| Irish | 98.6 /100 | #78 | Exceptional 87.6% |
| English | 98.6 /100 | #79 | Exceptional 87.6% |
Demographics Similar to Immigrants from Poland by GED/Equivalency
In terms of ged/equivalency, the demographic groups most similar to Immigrants from Poland are Basque (86.4%, a difference of 0.0%), Immigrants from Northern Africa (86.3%, a difference of 0.0%), Menominee (86.3%, a difference of 0.0%), Immigrants from Western Asia (86.3%, a difference of 0.020%), and Pakistani (86.4%, a difference of 0.030%).
| Demographics | Rating | Rank | GED/Equivalency |
| Laotians | 83.2 /100 | #141 | Excellent 86.5% |
| Immigrants | Indonesia | 82.4 /100 | #142 | Excellent 86.4% |
| Immigrants | Pakistan | 82.4 /100 | #143 | Excellent 86.4% |
| Bolivians | 82.1 /100 | #144 | Excellent 86.4% |
| Pakistanis | 80.4 /100 | #145 | Excellent 86.4% |
| Basques | 79.5 /100 | #146 | Good 86.4% |
| Immigrants | Northern Africa | 79.3 /100 | #147 | Good 86.3% |
| Immigrants | Poland | 79.3 /100 | #148 | Good 86.3% |
| Menominee | 79.3 /100 | #149 | Good 86.3% |
| Immigrants | Western Asia | 78.8 /100 | #150 | Good 86.3% |
| Immigrants | Bosnia and Herzegovina | 77.9 /100 | #151 | Good 86.3% |
| Brazilians | 77.2 /100 | #152 | Good 86.3% |
| Kenyans | 76.6 /100 | #153 | Good 86.3% |
| Armenians | 76.4 /100 | #154 | Good 86.3% |
| Iraqis | 75.2 /100 | #155 | Good 86.2% |