Immigrants from Italy vs Aleut College, Under 1 year
COMPARE
Immigrants from Italy
Aleut
College, Under 1 year
College, Under 1 year Comparison
Immigrants from Italy
Aleuts
66.8%
COLLEGE, UNDER 1 YEAR
86.9/ 100
METRIC RATING
138th/ 347
METRIC RANK
62.2%
COLLEGE, UNDER 1 YEAR
1.1/ 100
METRIC RATING
240th/ 347
METRIC RANK
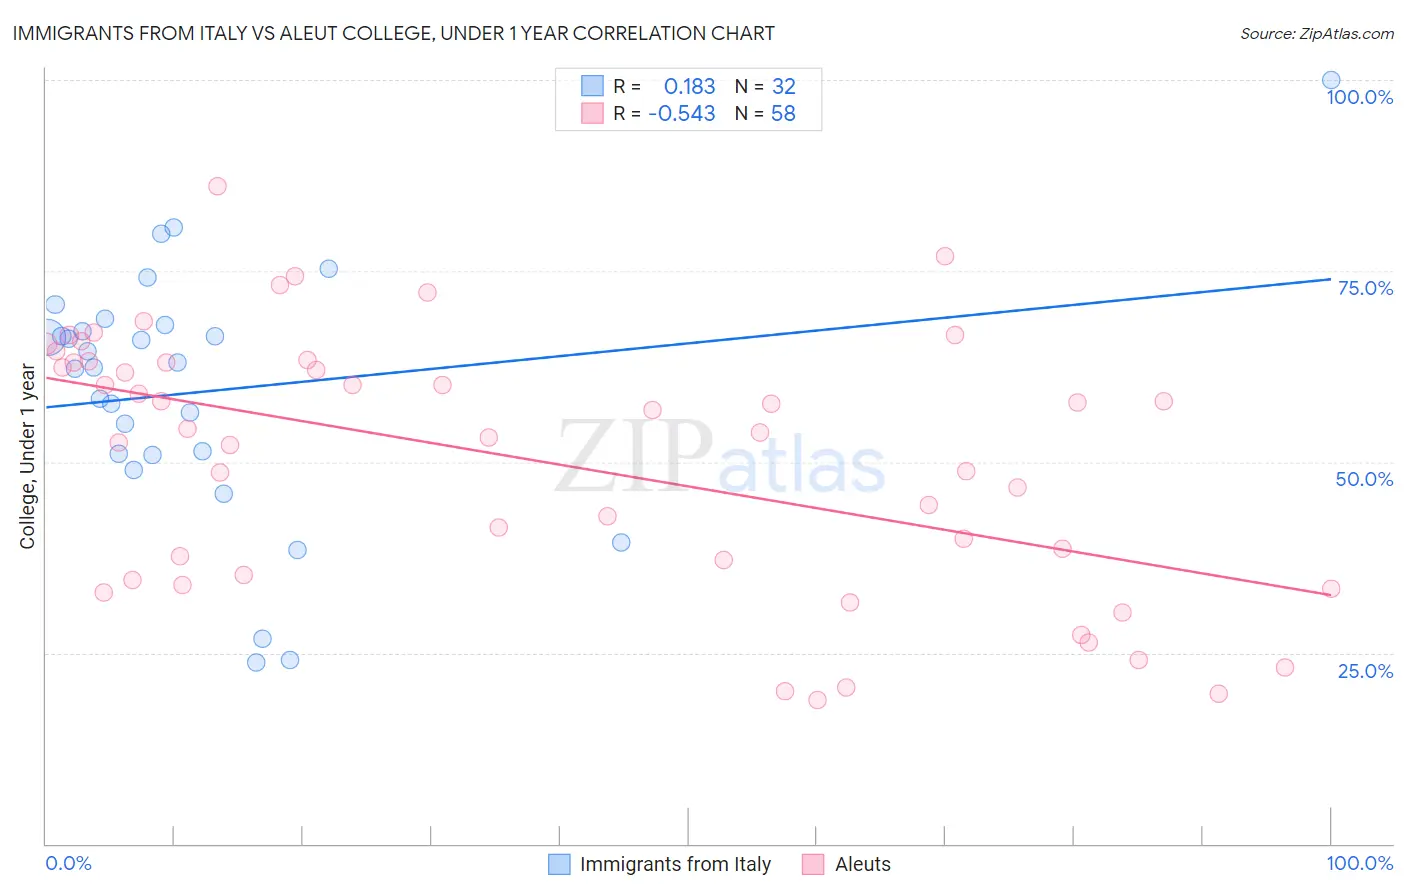
Immigrants from Italy vs Aleut College, Under 1 year Correlation Chart
The statistical analysis conducted on geographies consisting of 324,223,988 people shows a poor positive correlation between the proportion of Immigrants from Italy and percentage of population with at least college, under 1 year education in the United States with a correlation coefficient (R) of 0.183 and weighted average of 66.8%. Similarly, the statistical analysis conducted on geographies consisting of 61,782,940 people shows a substantial negative correlation between the proportion of Aleuts and percentage of population with at least college, under 1 year education in the United States with a correlation coefficient (R) of -0.543 and weighted average of 62.2%, a difference of 7.4%.
College, Under 1 year Correlation Summary
| Measurement | Immigrants from Italy | Aleut |
| Minimum | 23.8% | 18.8% |
| Maximum | 100.0% | 86.1% |
| Range | 76.2% | 67.4% |
| Mean | 59.2% | 50.3% |
| Median | 62.7% | 54.1% |
| Interquartile 25% (IQ1) | 51.0% | 35.3% |
| Interquartile 75% (IQ3) | 67.5% | 63.1% |
| Interquartile Range (IQR) | 16.5% | 27.8% |
| Standard Deviation (Sample) | 16.6% | 16.9% |
| Standard Deviation (Population) | 16.4% | 16.7% |
Similar Demographics by College, Under 1 year
Demographics Similar to Immigrants from Italy by College, Under 1 year
In terms of college, under 1 year, the demographic groups most similar to Immigrants from Italy are Immigrants from Chile (66.8%, a difference of 0.050%), Ugandan (66.8%, a difference of 0.080%), Canadian (66.8%, a difference of 0.090%), Iraqi (66.8%, a difference of 0.10%), and Venezuelan (66.7%, a difference of 0.10%).
| Demographics | Rating | Rank | College, Under 1 year |
| Finns | 88.6 /100 | #131 | Excellent 66.9% |
| Poles | 88.4 /100 | #132 | Excellent 66.9% |
| Immigrants | Brazil | 88.3 /100 | #133 | Excellent 66.9% |
| Iraqis | 88.0 /100 | #134 | Excellent 66.8% |
| Canadians | 87.9 /100 | #135 | Excellent 66.8% |
| Ugandans | 87.8 /100 | #136 | Excellent 66.8% |
| Immigrants | Chile | 87.4 /100 | #137 | Excellent 66.8% |
| Immigrants | Italy | 86.9 /100 | #138 | Excellent 66.8% |
| Venezuelans | 85.9 /100 | #139 | Excellent 66.7% |
| Slavs | 85.9 /100 | #140 | Excellent 66.7% |
| Immigrants | Afghanistan | 85.1 /100 | #141 | Excellent 66.7% |
| English | 82.9 /100 | #142 | Excellent 66.6% |
| Immigrants | Uganda | 82.8 /100 | #143 | Excellent 66.5% |
| Immigrants | Germany | 82.0 /100 | #144 | Excellent 66.5% |
| Immigrants | Kenya | 81.8 /100 | #145 | Excellent 66.5% |
Demographics Similar to Aleuts by College, Under 1 year
In terms of college, under 1 year, the demographic groups most similar to Aleuts are Nepalese (62.2%, a difference of 0.0%), Ottawa (62.2%, a difference of 0.010%), Malaysian (62.2%, a difference of 0.060%), Hawaiian (62.1%, a difference of 0.090%), and Colville (62.1%, a difference of 0.18%).
| Demographics | Rating | Rank | College, Under 1 year |
| Iroquois | 2.0 /100 | #233 | Tragic 62.6% |
| Chippewa | 2.0 /100 | #234 | Tragic 62.6% |
| Spanish Americans | 1.9 /100 | #235 | Tragic 62.6% |
| Immigrants | Immigrants | 1.7 /100 | #236 | Tragic 62.5% |
| Immigrants | Burma/Myanmar | 1.6 /100 | #237 | Tragic 62.5% |
| French American Indians | 1.5 /100 | #238 | Tragic 62.4% |
| Nepalese | 1.1 /100 | #239 | Tragic 62.2% |
| Aleuts | 1.1 /100 | #240 | Tragic 62.2% |
| Ottawa | 1.1 /100 | #241 | Tragic 62.2% |
| Malaysians | 1.1 /100 | #242 | Tragic 62.2% |
| Hawaiians | 1.1 /100 | #243 | Tragic 62.1% |
| Colville | 1.0 /100 | #244 | Tragic 62.1% |
| Delaware | 0.9 /100 | #245 | Tragic 62.1% |
| Marshallese | 0.8 /100 | #246 | Tragic 61.9% |
| Immigrants | Liberia | 0.8 /100 | #247 | Tragic 61.9% |