Immigrants from Senegal vs Scotch-Irish 7th Grade
COMPARE
Immigrants from Senegal
Scotch-Irish
7th Grade
7th Grade Comparison
Immigrants from Senegal
Scotch-Irish
95.5%
7TH GRADE
1.9/ 100
METRIC RATING
242nd/ 347
METRIC RANK
97.4%
7TH GRADE
100.0/ 100
METRIC RATING
26th/ 347
METRIC RANK
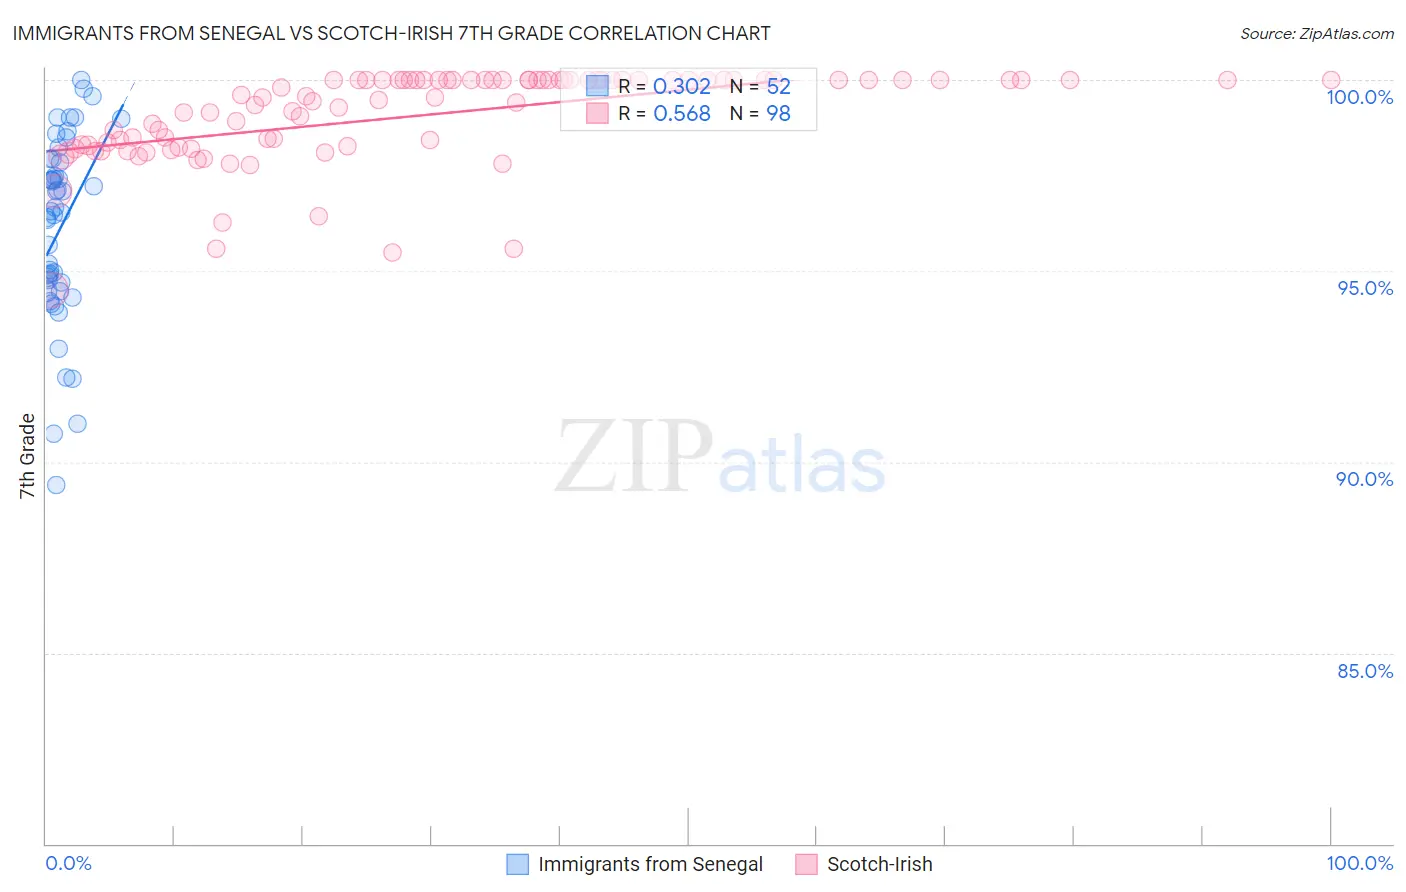
Immigrants from Senegal vs Scotch-Irish 7th Grade Correlation Chart
The statistical analysis conducted on geographies consisting of 90,130,297 people shows a mild positive correlation between the proportion of Immigrants from Senegal and percentage of population with at least 7th grade education in the United States with a correlation coefficient (R) of 0.302 and weighted average of 95.5%. Similarly, the statistical analysis conducted on geographies consisting of 548,777,407 people shows a substantial positive correlation between the proportion of Scotch-Irish and percentage of population with at least 7th grade education in the United States with a correlation coefficient (R) of 0.568 and weighted average of 97.4%, a difference of 2.0%.
7th Grade Correlation Summary
| Measurement | Immigrants from Senegal | Scotch-Irish |
| Minimum | 89.4% | 94.5% |
| Maximum | 100.0% | 100.0% |
| Range | 10.6% | 5.5% |
| Mean | 96.1% | 99.1% |
| Median | 96.6% | 99.6% |
| Interquartile 25% (IQ1) | 94.6% | 98.3% |
| Interquartile 75% (IQ3) | 97.9% | 100.0% |
| Interquartile Range (IQR) | 3.3% | 1.7% |
| Standard Deviation (Sample) | 2.4% | 1.2% |
| Standard Deviation (Population) | 2.4% | 1.2% |
Similar Demographics by 7th Grade
Demographics Similar to Immigrants from Senegal by 7th Grade
In terms of 7th grade, the demographic groups most similar to Immigrants from Senegal are Immigrants from Sierra Leone (95.5%, a difference of 0.0%), South American Indian (95.5%, a difference of 0.0%), Jamaican (95.5%, a difference of 0.020%), U.S. Virgin Islander (95.4%, a difference of 0.020%), and Immigrants from Asia (95.5%, a difference of 0.030%).
| Demographics | Rating | Rank | 7th Grade |
| Immigrants | Africa | 2.7 /100 | #235 | Tragic 95.5% |
| Asians | 2.6 /100 | #236 | Tragic 95.5% |
| Immigrants | Asia | 2.3 /100 | #237 | Tragic 95.5% |
| Indians (Asian) | 2.3 /100 | #238 | Tragic 95.5% |
| Jamaicans | 2.2 /100 | #239 | Tragic 95.5% |
| Immigrants | Sierra Leone | 2.0 /100 | #240 | Tragic 95.5% |
| South American Indians | 2.0 /100 | #241 | Tragic 95.5% |
| Immigrants | Senegal | 1.9 /100 | #242 | Tragic 95.5% |
| U.S. Virgin Islanders | 1.6 /100 | #243 | Tragic 95.4% |
| Uruguayans | 1.6 /100 | #244 | Tragic 95.4% |
| Immigrants | Middle Africa | 1.5 /100 | #245 | Tragic 95.4% |
| Ethiopians | 1.5 /100 | #246 | Tragic 95.4% |
| Tongans | 1.3 /100 | #247 | Tragic 95.4% |
| Paiute | 1.2 /100 | #248 | Tragic 95.4% |
| Bolivians | 1.1 /100 | #249 | Tragic 95.4% |
Demographics Similar to Scotch-Irish by 7th Grade
In terms of 7th grade, the demographic groups most similar to Scotch-Irish are Danish (97.4%, a difference of 0.0%), Welsh (97.4%, a difference of 0.010%), French (97.4%, a difference of 0.010%), Croatian (97.4%, a difference of 0.020%), and Sioux (97.4%, a difference of 0.020%).
| Demographics | Rating | Rank | 7th Grade |
| Lithuanians | 100.0 /100 | #19 | Exceptional 97.5% |
| Yup'ik | 100.0 /100 | #20 | Exceptional 97.4% |
| Inupiat | 100.0 /100 | #21 | Exceptional 97.4% |
| French Canadians | 100.0 /100 | #22 | Exceptional 97.4% |
| Croatians | 100.0 /100 | #23 | Exceptional 97.4% |
| Welsh | 100.0 /100 | #24 | Exceptional 97.4% |
| French | 100.0 /100 | #25 | Exceptional 97.4% |
| Scotch-Irish | 100.0 /100 | #26 | Exceptional 97.4% |
| Danes | 100.0 /100 | #27 | Exceptional 97.4% |
| Sioux | 100.0 /100 | #28 | Exceptional 97.4% |
| Scandinavians | 100.0 /100 | #29 | Exceptional 97.4% |
| Czechs | 100.0 /100 | #30 | Exceptional 97.4% |
| Europeans | 100.0 /100 | #31 | Exceptional 97.3% |
| Italians | 100.0 /100 | #32 | Exceptional 97.3% |
| Chippewa | 100.0 /100 | #33 | Exceptional 97.3% |