Shoshone vs Scotch-Irish 7th Grade
COMPARE
Shoshone
Scotch-Irish
7th Grade
7th Grade Comparison
Shoshone
Scotch-Irish
96.6%
7TH GRADE
98.1/ 100
METRIC RATING
104th/ 347
METRIC RANK
97.4%
7TH GRADE
100.0/ 100
METRIC RATING
26th/ 347
METRIC RANK
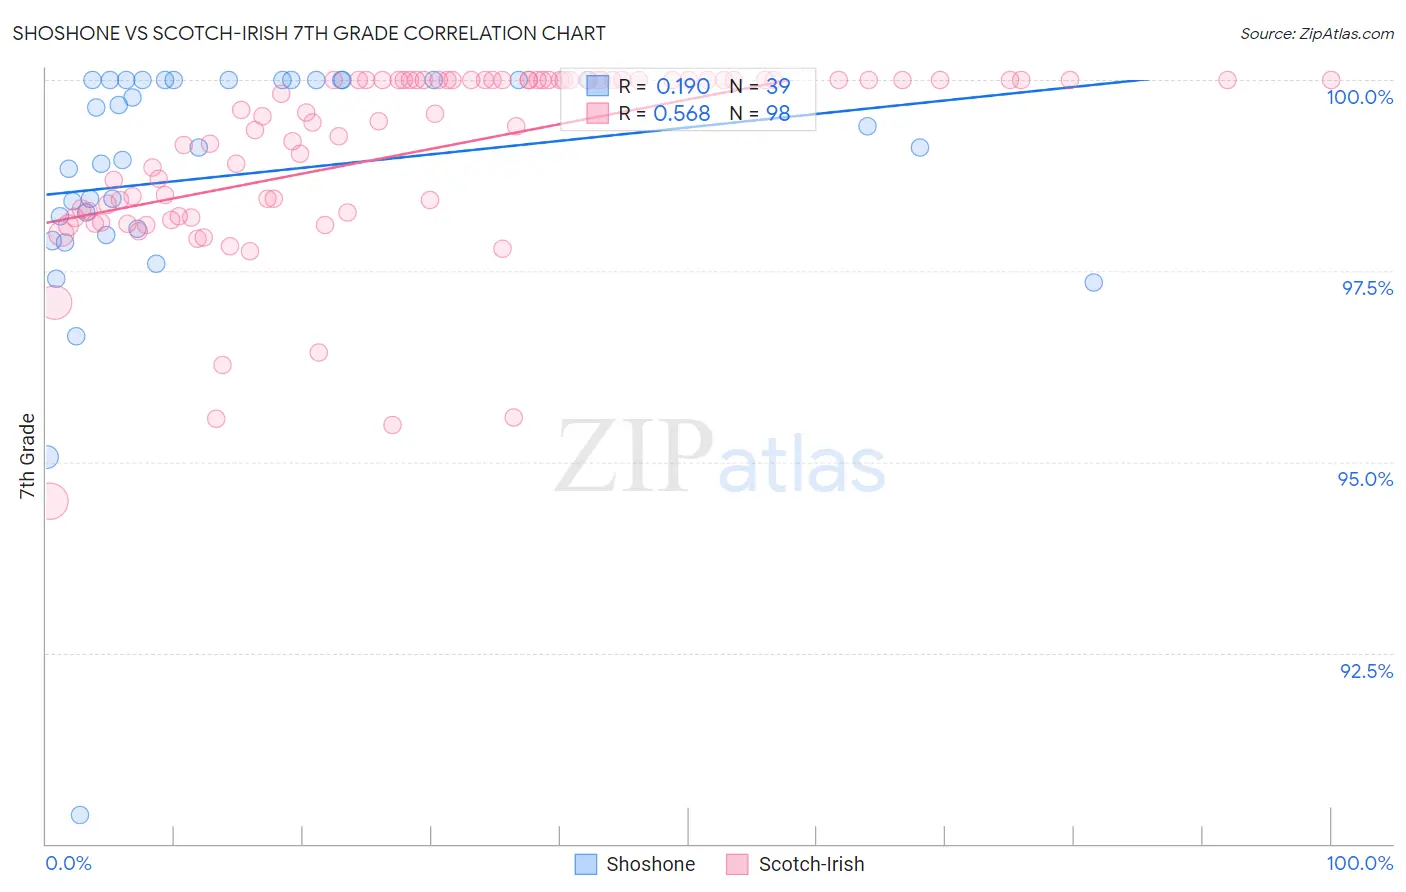
Shoshone vs Scotch-Irish 7th Grade Correlation Chart
The statistical analysis conducted on geographies consisting of 66,625,086 people shows a poor positive correlation between the proportion of Shoshone and percentage of population with at least 7th grade education in the United States with a correlation coefficient (R) of 0.190 and weighted average of 96.6%. Similarly, the statistical analysis conducted on geographies consisting of 548,777,407 people shows a substantial positive correlation between the proportion of Scotch-Irish and percentage of population with at least 7th grade education in the United States with a correlation coefficient (R) of 0.568 and weighted average of 97.4%, a difference of 0.80%.
7th Grade Correlation Summary
| Measurement | Shoshone | Scotch-Irish |
| Minimum | 90.4% | 94.5% |
| Maximum | 100.0% | 100.0% |
| Range | 9.6% | 5.5% |
| Mean | 98.8% | 99.1% |
| Median | 99.1% | 99.6% |
| Interquartile 25% (IQ1) | 98.1% | 98.3% |
| Interquartile 75% (IQ3) | 100.0% | 100.0% |
| Interquartile Range (IQR) | 1.9% | 1.7% |
| Standard Deviation (Sample) | 1.8% | 1.2% |
| Standard Deviation (Population) | 1.8% | 1.2% |
Similar Demographics by 7th Grade
Demographics Similar to Shoshone by 7th Grade
In terms of 7th grade, the demographic groups most similar to Shoshone are South African (96.6%, a difference of 0.010%), Iroquois (96.6%, a difference of 0.010%), Immigrants from Czechoslovakia (96.6%, a difference of 0.020%), Immigrants from Singapore (96.6%, a difference of 0.020%), and Lumbee (96.6%, a difference of 0.020%).
| Demographics | Rating | Rank | 7th Grade |
| Immigrants | Germany | 98.7 /100 | #97 | Exceptional 96.7% |
| Immigrants | Sweden | 98.7 /100 | #98 | Exceptional 96.7% |
| Menominee | 98.7 /100 | #99 | Exceptional 96.7% |
| German Russians | 98.6 /100 | #100 | Exceptional 96.7% |
| Thais | 98.6 /100 | #101 | Exceptional 96.7% |
| Immigrants | Czechoslovakia | 98.3 /100 | #102 | Exceptional 96.6% |
| Immigrants | Singapore | 98.3 /100 | #103 | Exceptional 96.6% |
| Shoshone | 98.1 /100 | #104 | Exceptional 96.6% |
| South Africans | 98.0 /100 | #105 | Exceptional 96.6% |
| Iroquois | 97.9 /100 | #106 | Exceptional 96.6% |
| Lumbee | 97.8 /100 | #107 | Exceptional 96.6% |
| Immigrants | Saudi Arabia | 97.8 /100 | #108 | Exceptional 96.6% |
| Bhutanese | 97.7 /100 | #109 | Exceptional 96.6% |
| Okinawans | 97.4 /100 | #110 | Exceptional 96.6% |
| Immigrants | Latvia | 97.4 /100 | #111 | Exceptional 96.6% |
Demographics Similar to Scotch-Irish by 7th Grade
In terms of 7th grade, the demographic groups most similar to Scotch-Irish are Danish (97.4%, a difference of 0.0%), Welsh (97.4%, a difference of 0.010%), French (97.4%, a difference of 0.010%), Croatian (97.4%, a difference of 0.020%), and Sioux (97.4%, a difference of 0.020%).
| Demographics | Rating | Rank | 7th Grade |
| Lithuanians | 100.0 /100 | #19 | Exceptional 97.5% |
| Yup'ik | 100.0 /100 | #20 | Exceptional 97.4% |
| Inupiat | 100.0 /100 | #21 | Exceptional 97.4% |
| French Canadians | 100.0 /100 | #22 | Exceptional 97.4% |
| Croatians | 100.0 /100 | #23 | Exceptional 97.4% |
| Welsh | 100.0 /100 | #24 | Exceptional 97.4% |
| French | 100.0 /100 | #25 | Exceptional 97.4% |
| Scotch-Irish | 100.0 /100 | #26 | Exceptional 97.4% |
| Danes | 100.0 /100 | #27 | Exceptional 97.4% |
| Sioux | 100.0 /100 | #28 | Exceptional 97.4% |
| Scandinavians | 100.0 /100 | #29 | Exceptional 97.4% |
| Czechs | 100.0 /100 | #30 | Exceptional 97.4% |
| Europeans | 100.0 /100 | #31 | Exceptional 97.3% |
| Italians | 100.0 /100 | #32 | Exceptional 97.3% |
| Chippewa | 100.0 /100 | #33 | Exceptional 97.3% |