Immigrants from Italy vs Colville 7th Grade
COMPARE
Immigrants from Italy
Colville
7th Grade
7th Grade Comparison
Immigrants from Italy
Colville
96.1%
7TH GRADE
62.1/ 100
METRIC RATING
164th/ 347
METRIC RANK
96.4%
7TH GRADE
91.7/ 100
METRIC RATING
132nd/ 347
METRIC RANK
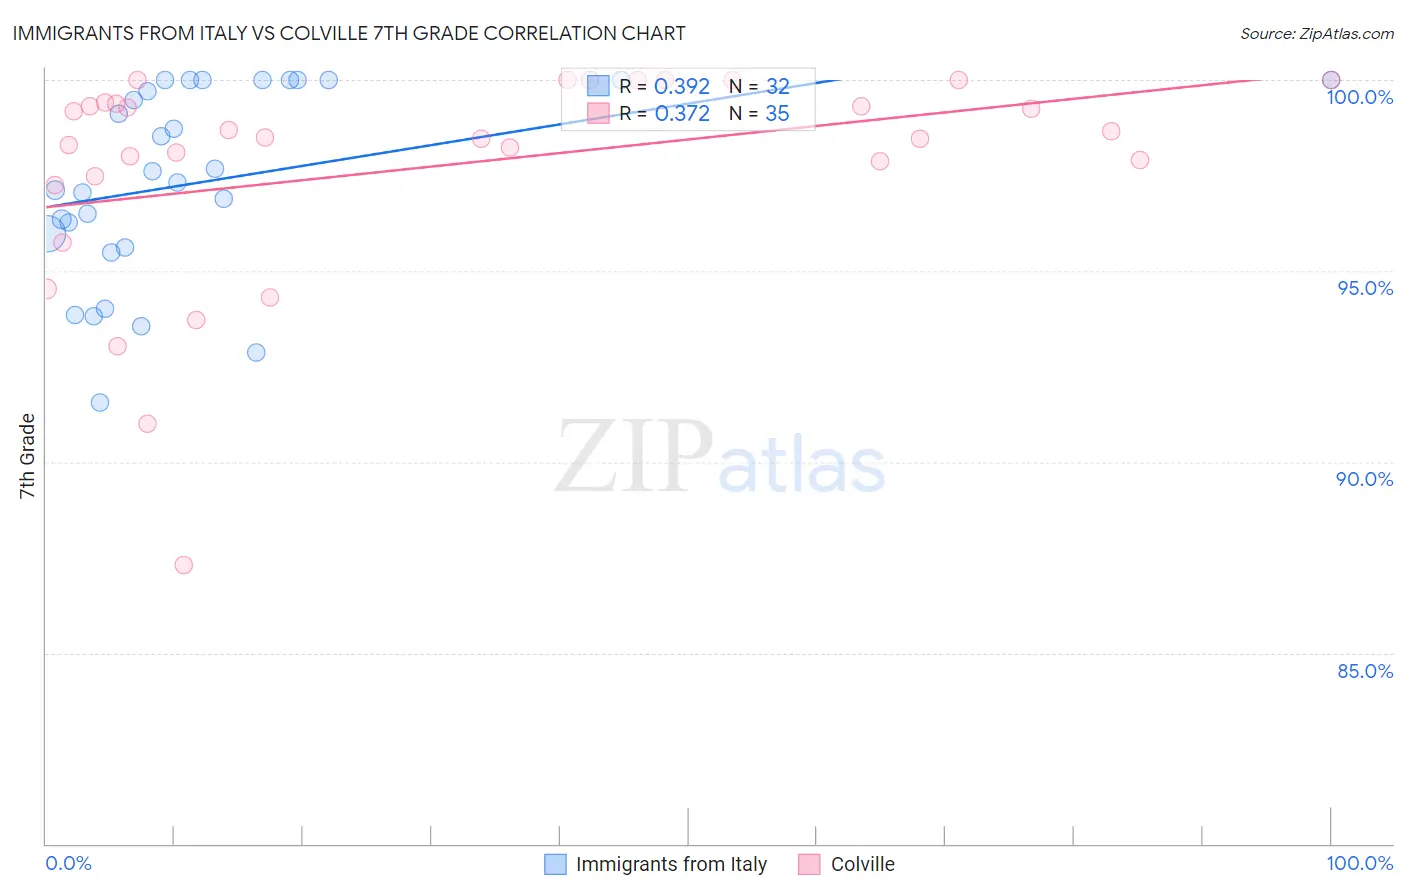
Immigrants from Italy vs Colville 7th Grade Correlation Chart
The statistical analysis conducted on geographies consisting of 324,226,009 people shows a mild positive correlation between the proportion of Immigrants from Italy and percentage of population with at least 7th grade education in the United States with a correlation coefficient (R) of 0.392 and weighted average of 96.1%. Similarly, the statistical analysis conducted on geographies consisting of 34,682,094 people shows a mild positive correlation between the proportion of Colville and percentage of population with at least 7th grade education in the United States with a correlation coefficient (R) of 0.372 and weighted average of 96.4%, a difference of 0.29%.
7th Grade Correlation Summary
| Measurement | Immigrants from Italy | Colville |
| Minimum | 91.6% | 87.3% |
| Maximum | 100.0% | 100.0% |
| Range | 8.4% | 12.7% |
| Mean | 97.3% | 97.7% |
| Median | 97.5% | 98.5% |
| Interquartile 25% (IQ1) | 95.8% | 97.5% |
| Interquartile 75% (IQ3) | 100.0% | 99.4% |
| Interquartile Range (IQR) | 4.2% | 1.9% |
| Standard Deviation (Sample) | 2.5% | 2.9% |
| Standard Deviation (Population) | 2.5% | 2.8% |
Similar Demographics by 7th Grade
Demographics Similar to Immigrants from Italy by 7th Grade
In terms of 7th grade, the demographic groups most similar to Immigrants from Italy are Spaniard (96.1%, a difference of 0.0%), Immigrants from Taiwan (96.1%, a difference of 0.0%), Pima (96.1%, a difference of 0.010%), Immigrants from Kazakhstan (96.1%, a difference of 0.010%), and Immigrants from Sri Lanka (96.1%, a difference of 0.010%).
| Demographics | Rating | Rank | 7th Grade |
| Ugandans | 75.5 /100 | #157 | Good 96.2% |
| Arabs | 68.6 /100 | #158 | Good 96.2% |
| Alsatians | 67.2 /100 | #159 | Good 96.1% |
| Immigrants | Kenya | 66.8 /100 | #160 | Good 96.1% |
| Bermudans | 66.3 /100 | #161 | Good 96.1% |
| Pima | 64.3 /100 | #162 | Good 96.1% |
| Spaniards | 62.6 /100 | #163 | Good 96.1% |
| Immigrants | Italy | 62.1 /100 | #164 | Good 96.1% |
| Immigrants | Taiwan | 61.5 /100 | #165 | Good 96.1% |
| Immigrants | Kazakhstan | 61.0 /100 | #166 | Good 96.1% |
| Immigrants | Sri Lanka | 59.9 /100 | #167 | Average 96.1% |
| Immigrants | Poland | 59.0 /100 | #168 | Average 96.1% |
| Ute | 55.8 /100 | #169 | Average 96.1% |
| Immigrants | Ukraine | 55.0 /100 | #170 | Average 96.1% |
| Egyptians | 54.2 /100 | #171 | Average 96.1% |
Demographics Similar to Colville by 7th Grade
In terms of 7th grade, the demographic groups most similar to Colville are Filipino (96.4%, a difference of 0.010%), Hmong (96.4%, a difference of 0.010%), Soviet Union (96.4%, a difference of 0.010%), Immigrants from Kuwait (96.4%, a difference of 0.010%), and Immigrants from Serbia (96.4%, a difference of 0.020%).
| Demographics | Rating | Rank | 7th Grade |
| Immigrants | Bulgaria | 94.0 /100 | #125 | Exceptional 96.4% |
| Palestinians | 93.5 /100 | #126 | Exceptional 96.4% |
| Immigrants | Bosnia and Herzegovina | 93.3 /100 | #127 | Exceptional 96.4% |
| Immigrants | Romania | 93.2 /100 | #128 | Exceptional 96.4% |
| Immigrants | North Macedonia | 93.1 /100 | #129 | Exceptional 96.4% |
| Immigrants | Serbia | 92.8 /100 | #130 | Exceptional 96.4% |
| Filipinos | 92.1 /100 | #131 | Exceptional 96.4% |
| Colville | 91.7 /100 | #132 | Exceptional 96.4% |
| Hmong | 91.5 /100 | #133 | Exceptional 96.4% |
| Soviet Union | 91.2 /100 | #134 | Exceptional 96.4% |
| Immigrants | Kuwait | 91.1 /100 | #135 | Exceptional 96.4% |
| Immigrants | Hungary | 90.6 /100 | #136 | Exceptional 96.4% |
| Immigrants | Turkey | 90.2 /100 | #137 | Exceptional 96.4% |
| Jordanians | 90.0 /100 | #138 | Excellent 96.4% |
| Basques | 89.3 /100 | #139 | Excellent 96.4% |