Japanese vs Scotch-Irish 7th Grade
COMPARE
Japanese
Scotch-Irish
7th Grade
7th Grade Comparison
Japanese
Scotch-Irish
94.0%
7TH GRADE
0.0/ 100
METRIC RATING
314th/ 347
METRIC RANK
97.4%
7TH GRADE
100.0/ 100
METRIC RATING
26th/ 347
METRIC RANK
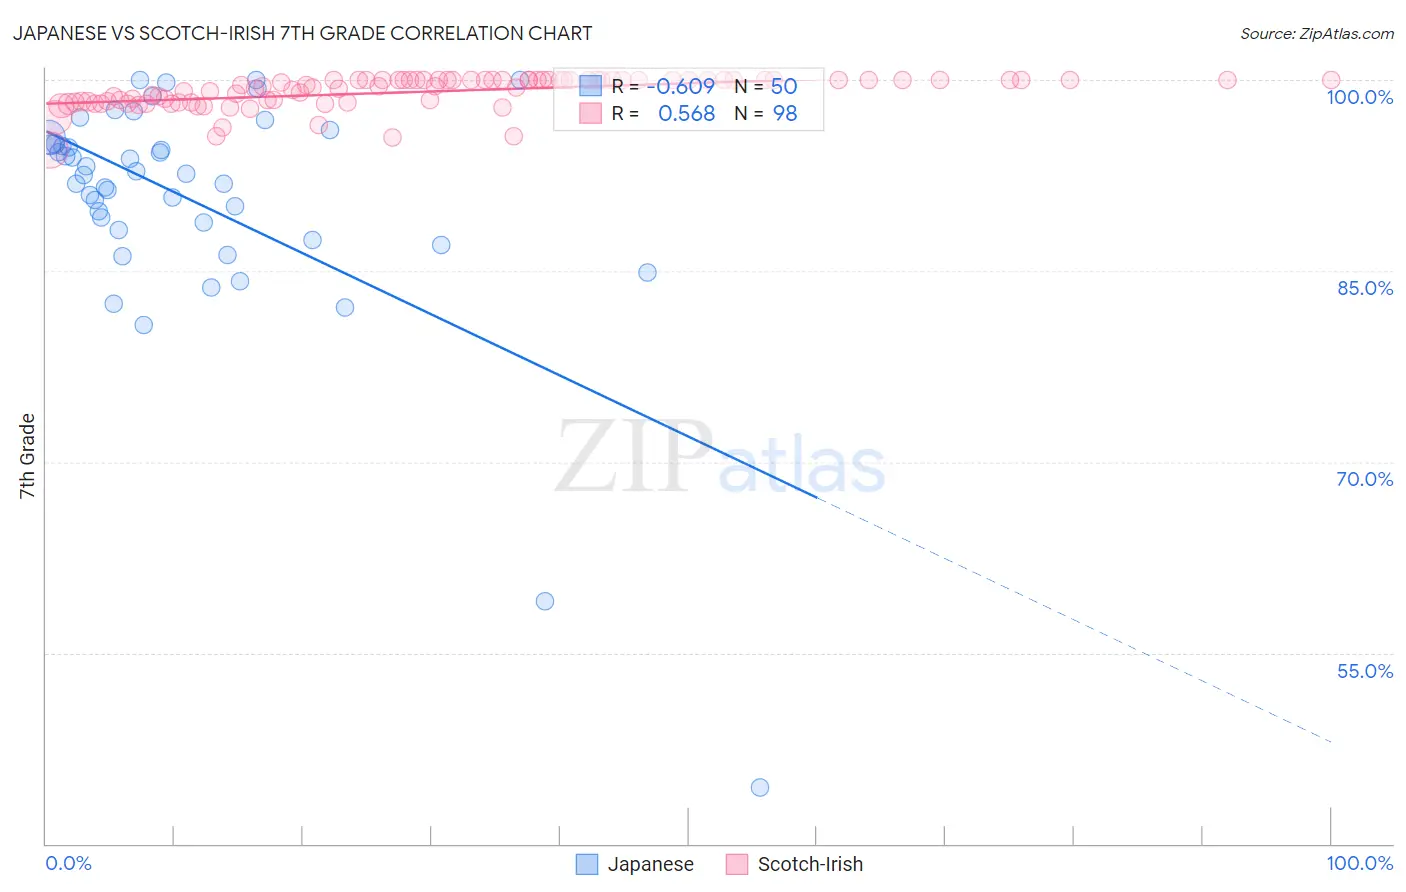
Japanese vs Scotch-Irish 7th Grade Correlation Chart
The statistical analysis conducted on geographies consisting of 249,183,224 people shows a significant negative correlation between the proportion of Japanese and percentage of population with at least 7th grade education in the United States with a correlation coefficient (R) of -0.609 and weighted average of 94.0%. Similarly, the statistical analysis conducted on geographies consisting of 548,777,407 people shows a substantial positive correlation between the proportion of Scotch-Irish and percentage of population with at least 7th grade education in the United States with a correlation coefficient (R) of 0.568 and weighted average of 97.4%, a difference of 3.6%.
7th Grade Correlation Summary
| Measurement | Japanese | Scotch-Irish |
| Minimum | 44.4% | 94.5% |
| Maximum | 100.0% | 100.0% |
| Range | 55.6% | 5.5% |
| Mean | 90.5% | 99.1% |
| Median | 92.6% | 99.6% |
| Interquartile 25% (IQ1) | 88.2% | 98.3% |
| Interquartile 75% (IQ3) | 95.0% | 100.0% |
| Interquartile Range (IQR) | 6.8% | 1.7% |
| Standard Deviation (Sample) | 9.5% | 1.2% |
| Standard Deviation (Population) | 9.4% | 1.2% |
Similar Demographics by 7th Grade
Demographics Similar to Japanese by 7th Grade
In terms of 7th grade, the demographic groups most similar to Japanese are Immigrants (94.0%, a difference of 0.030%), Immigrants from Bangladesh (94.0%, a difference of 0.030%), Vietnamese (93.9%, a difference of 0.050%), Puerto Rican (94.0%, a difference of 0.070%), and Immigrants from Caribbean (94.0%, a difference of 0.080%).
| Demographics | Rating | Rank | 7th Grade |
| Immigrants | Portugal | 0.0 /100 | #307 | Tragic 94.2% |
| Cape Verdeans | 0.0 /100 | #308 | Tragic 94.1% |
| Ecuadorians | 0.0 /100 | #309 | Tragic 94.0% |
| Immigrants | Caribbean | 0.0 /100 | #310 | Tragic 94.0% |
| Puerto Ricans | 0.0 /100 | #311 | Tragic 94.0% |
| Immigrants | Immigrants | 0.0 /100 | #312 | Tragic 94.0% |
| Immigrants | Bangladesh | 0.0 /100 | #313 | Tragic 94.0% |
| Japanese | 0.0 /100 | #314 | Tragic 94.0% |
| Vietnamese | 0.0 /100 | #315 | Tragic 93.9% |
| Immigrants | Vietnam | 0.0 /100 | #316 | Tragic 93.9% |
| Immigrants | Cuba | 0.0 /100 | #317 | Tragic 93.8% |
| Immigrants | Ecuador | 0.0 /100 | #318 | Tragic 93.7% |
| Immigrants | Cambodia | 0.0 /100 | #319 | Tragic 93.7% |
| Immigrants | Fiji | 0.0 /100 | #320 | Tragic 93.5% |
| Belizeans | 0.0 /100 | #321 | Tragic 93.5% |
Demographics Similar to Scotch-Irish by 7th Grade
In terms of 7th grade, the demographic groups most similar to Scotch-Irish are Danish (97.4%, a difference of 0.0%), Welsh (97.4%, a difference of 0.010%), French (97.4%, a difference of 0.010%), Croatian (97.4%, a difference of 0.020%), and Sioux (97.4%, a difference of 0.020%).
| Demographics | Rating | Rank | 7th Grade |
| Lithuanians | 100.0 /100 | #19 | Exceptional 97.5% |
| Yup'ik | 100.0 /100 | #20 | Exceptional 97.4% |
| Inupiat | 100.0 /100 | #21 | Exceptional 97.4% |
| French Canadians | 100.0 /100 | #22 | Exceptional 97.4% |
| Croatians | 100.0 /100 | #23 | Exceptional 97.4% |
| Welsh | 100.0 /100 | #24 | Exceptional 97.4% |
| French | 100.0 /100 | #25 | Exceptional 97.4% |
| Scotch-Irish | 100.0 /100 | #26 | Exceptional 97.4% |
| Danes | 100.0 /100 | #27 | Exceptional 97.4% |
| Sioux | 100.0 /100 | #28 | Exceptional 97.4% |
| Scandinavians | 100.0 /100 | #29 | Exceptional 97.4% |
| Czechs | 100.0 /100 | #30 | Exceptional 97.4% |
| Europeans | 100.0 /100 | #31 | Exceptional 97.3% |
| Italians | 100.0 /100 | #32 | Exceptional 97.3% |
| Chippewa | 100.0 /100 | #33 | Exceptional 97.3% |